QQQ

Charts of Interest - Weekly Perspective


           A lot of stocks on the Market Smith Growth 250+ list have made runs of 20%-100% since the beginning of this intermediate up trend that began on on the low of 11/16/12 and really got moving on 12/31/12. For me, just because the Indexes are starting to act sloppy and erratic doesn't mean I am hoping on the short side and I am not cutting my longs either. This is one of those times where less is more. I have taken profits in most of my winning positions and down to core size in each. Trails stops set in what I have left.
         This is just a list of names that have come across my scans. I continually watch for names that hold up well in corrective and choppy markets.

 "Plan your trades and trade your plan."


SSYS & DDD


Are You Frustrated Yet?

            I've noticed a lot of frustration on the stream as of lately. The gaps whether they fade or trend seem to be difficult to trade and trust. I just wanted to mention a couple of things that have lead to a decrease in my frustration levels.
          Once I noticed that many of my trades were being stopped out at a loss or trail stops hit in fairly short amount of time, I decrease the amount of trades I enter. This is also considering I feel my entry and stop placements are correct, following my strategy and rules for risk management.
           I pass on a lot and become much more picky...Volume being the number one indicator I watch.
           Depending on the size of the move I think the trade may make, I either drop my share size and widen my stop a bit, or tighten the stop all together. I prefer the dropping share size and widening stops.
          Were not in a trending market yet. So to flip flop back and forth from bearish to bullish makes no sense IMO. Having unrealistic expectations of follow thru on either the long or short side doesn't make much sense to me either. While having potential trade set ups is just part of doing the homework like @ChessNWine mentioned in his video the other day.

Here are a couple of links for Day and Swing traders that may or may not help.


Charts of Interest - $SPY $QQQ $ALXN $V $PANL $QCOR $FFIV $HANS

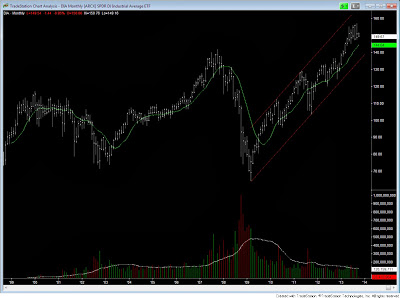
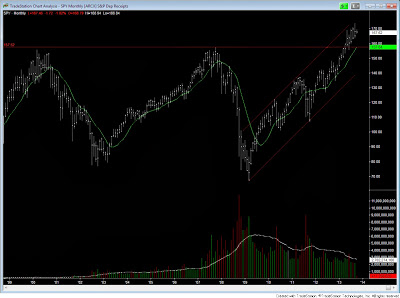
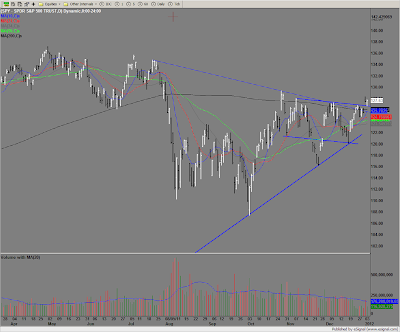
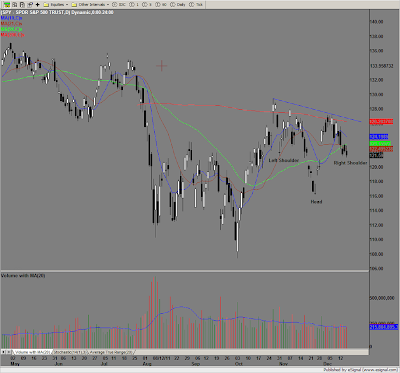
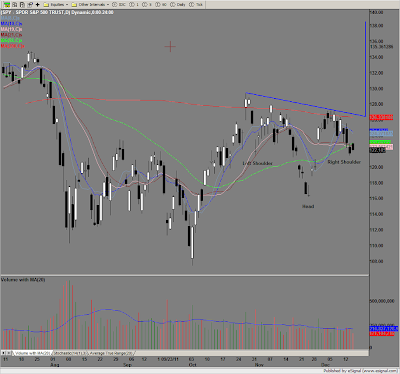
Spy - Possibly forming right shoulder. Would not be confirmed until neckline is broken. Plenty of time.
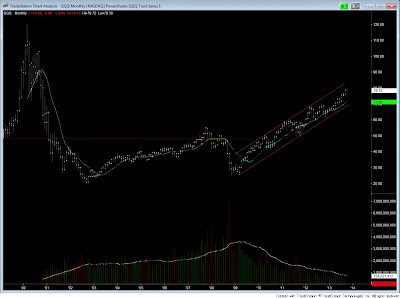
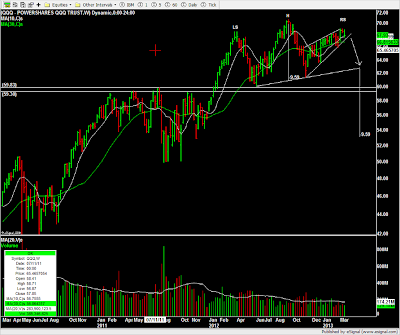
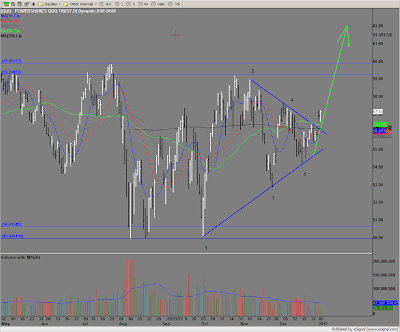
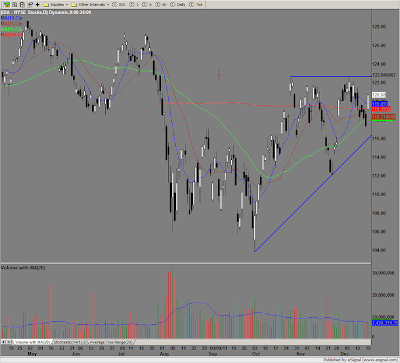
QQQ Range

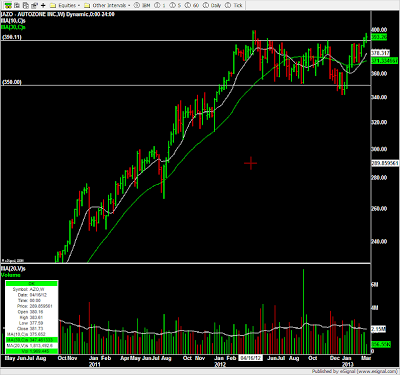
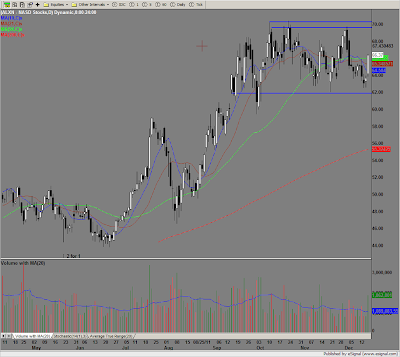
ALXN - Pocket pivot move as it cleared 10,21, and 50 day moving averages. Still with in this range.

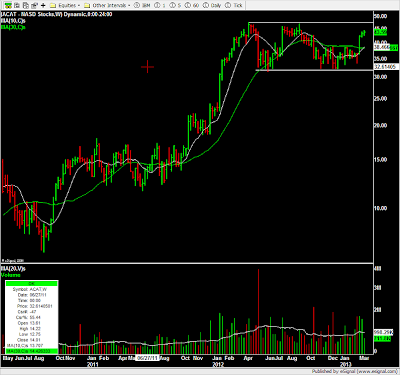
CATM - On watch, with alerts set at a break of this descending trend line.

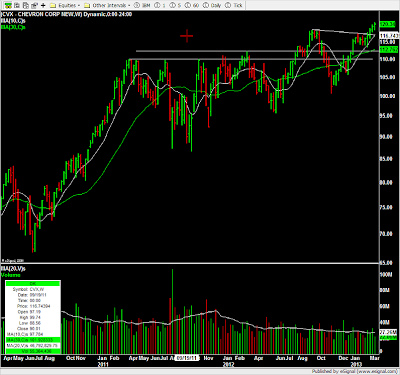
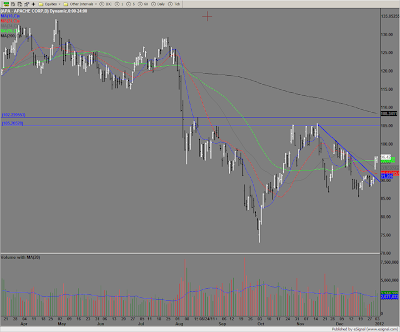
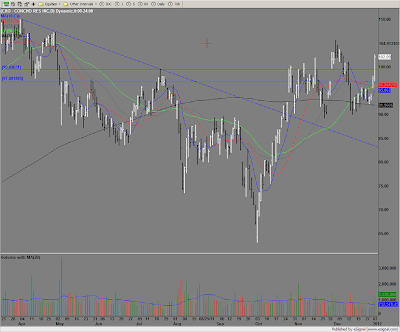
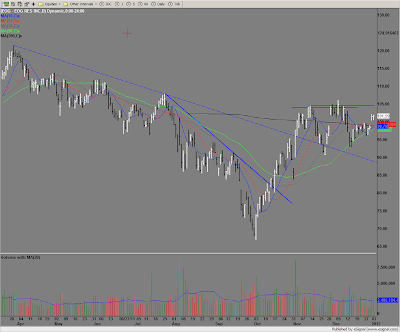
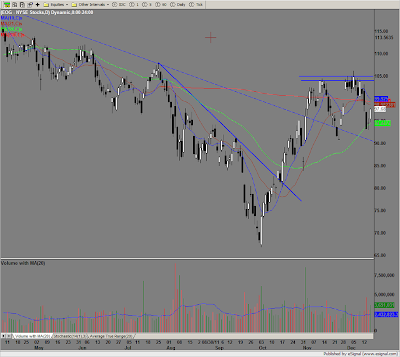
EOG- Held 50d, which is a good sign. Still watching the 105 area.

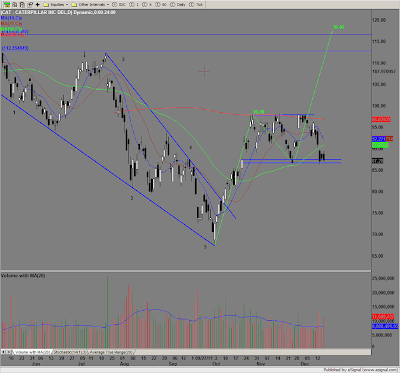
Cat testing the lower end of its range. Needs to hold. 

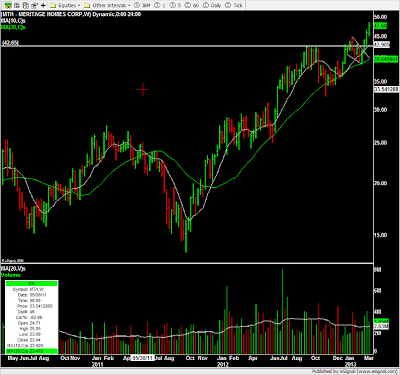
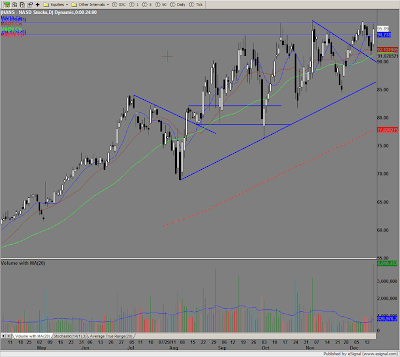
HANS - Pocket pivot move on Friday. Long entry thru 97.00

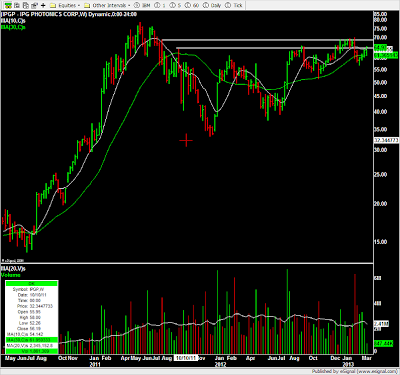
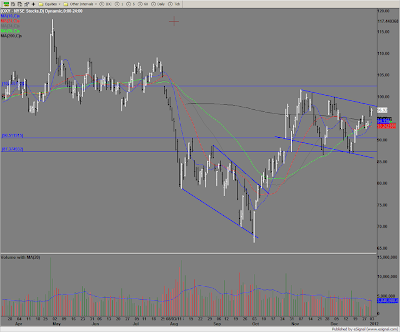
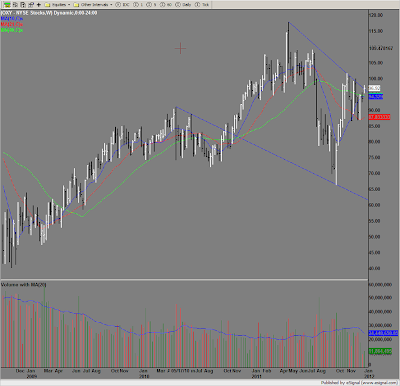
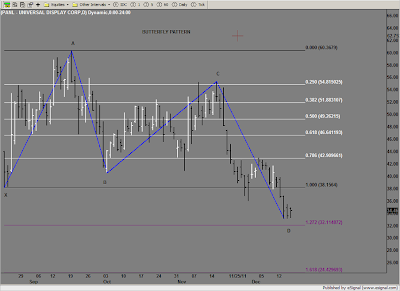
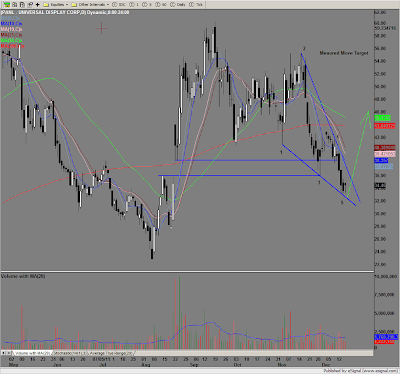
A couple different looks at PANL. Butterfly and descending wedge 


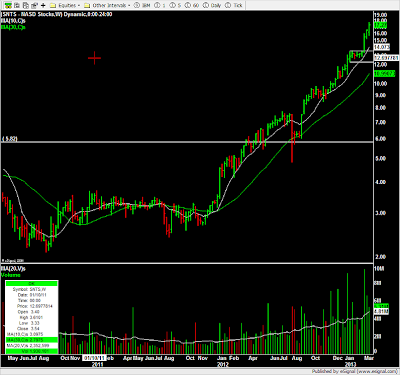
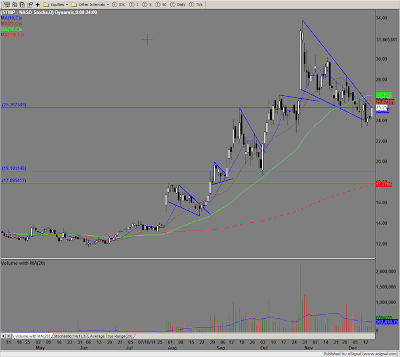
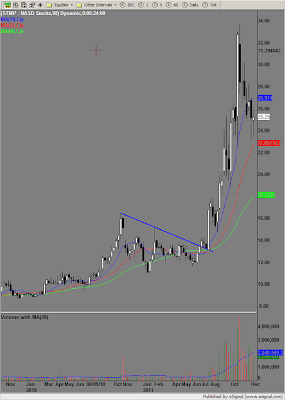
STMP - Descending Wedge. On the weekly, has held 21wk moving average so far. 


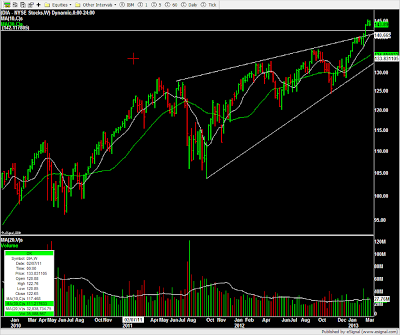
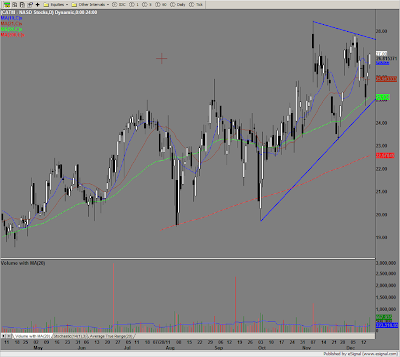
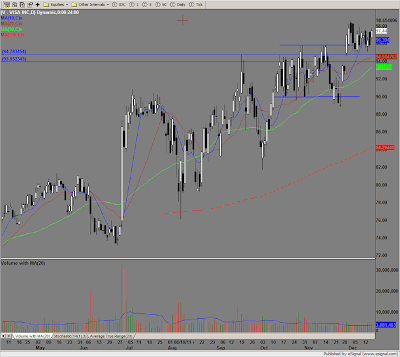
V - Holding up and basing. Will add thru highs. 

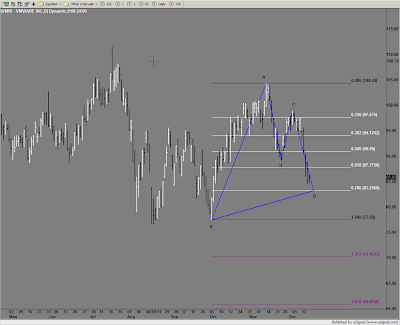
VMW - Possible Gartley long entry setting up here. 


$SPY $QQQ - Bullish Optimism.. Inverse H&S

Possibly forming the right shoulder. The Measured Move on a Head and Shoulders is from the head to the neckline. I measure the first target from point of breaking the neckline, not through the high of the pattern, if that makes sense. That is just how I measure it. If this pattern completed, it would put the Spyders in new high territory, 138 area. 
If the Inverse Head and Shoulders completes. This bearish weekly ascending wedge would be considered failed.

 QQQ - Range bound and starting to reach the pinnacle of this triangle.