Charts of Interest
Remember, it [the market] is designed to fool most of the people most of the time.
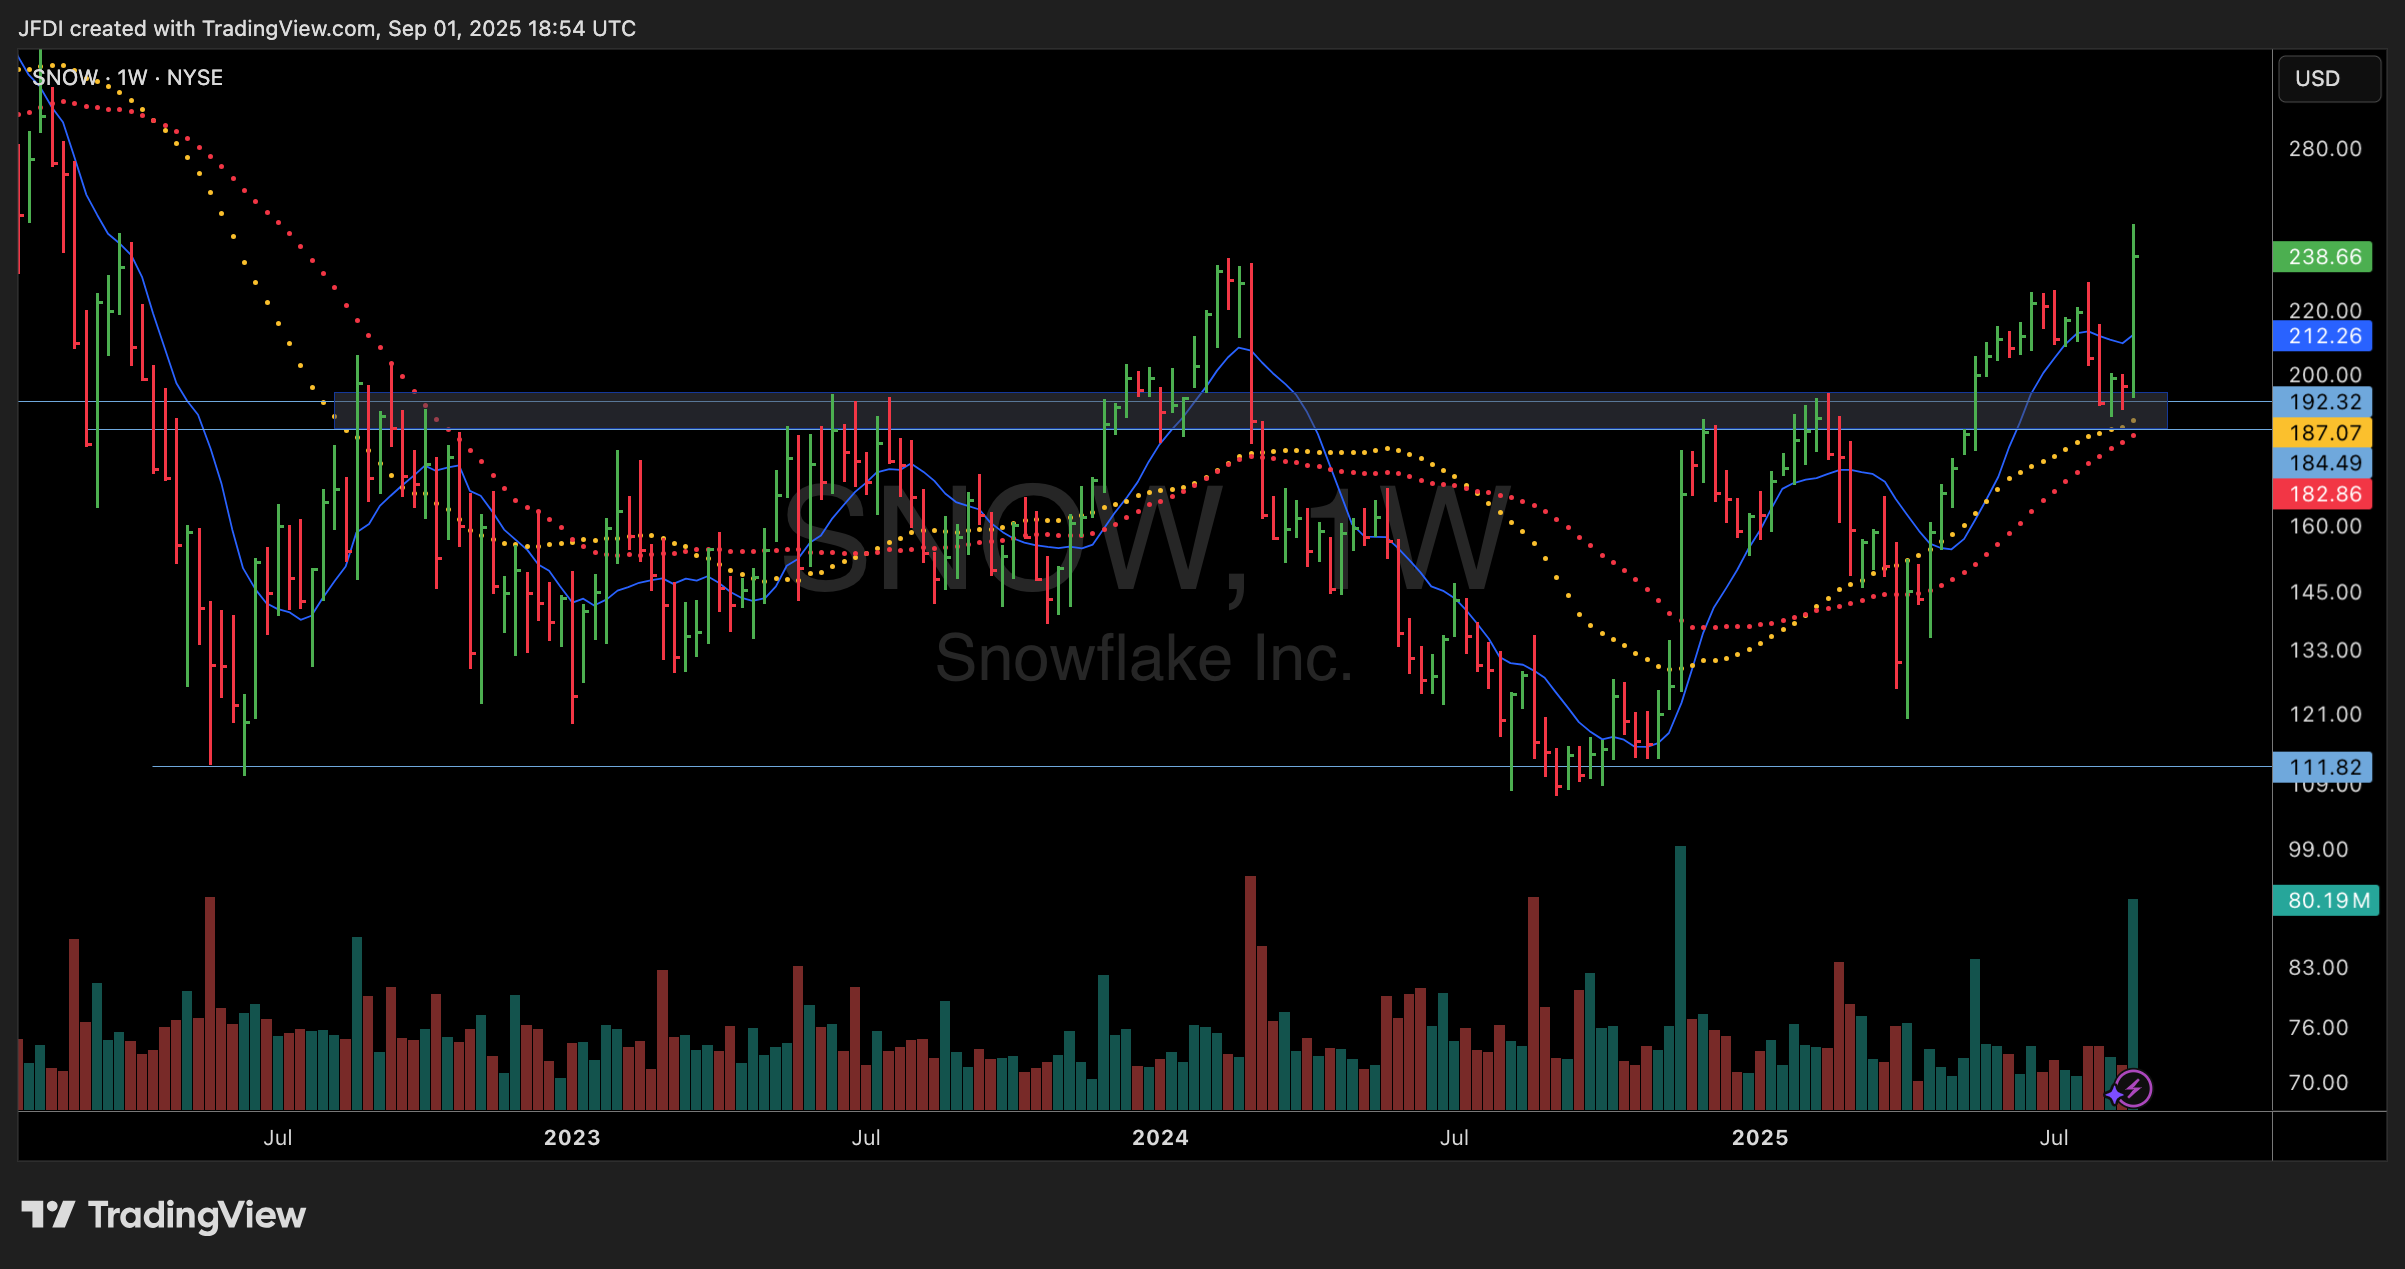
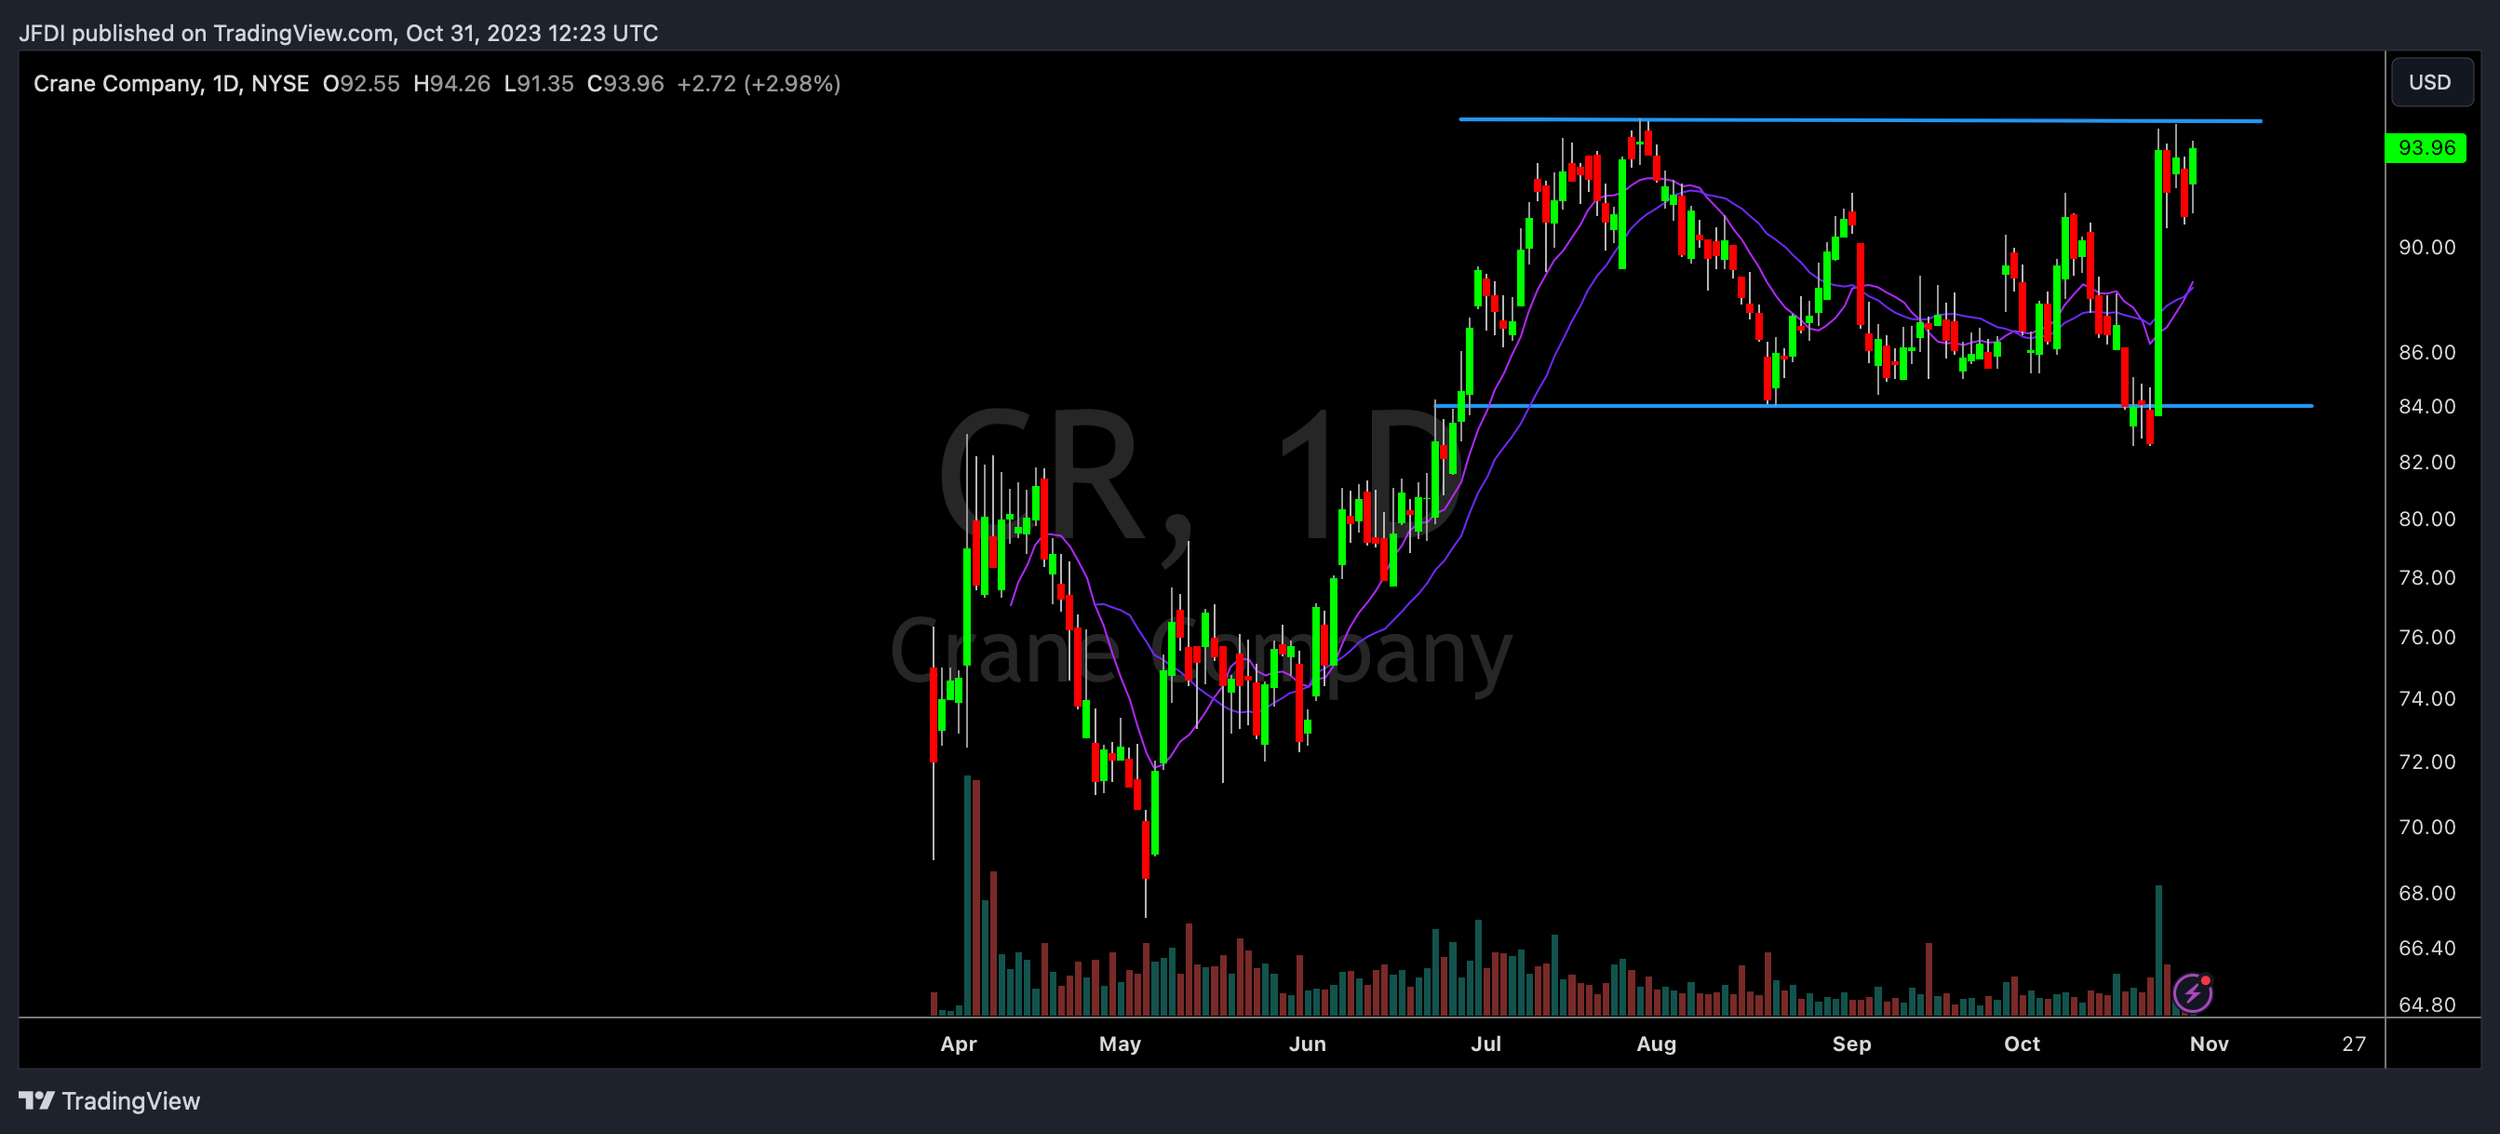
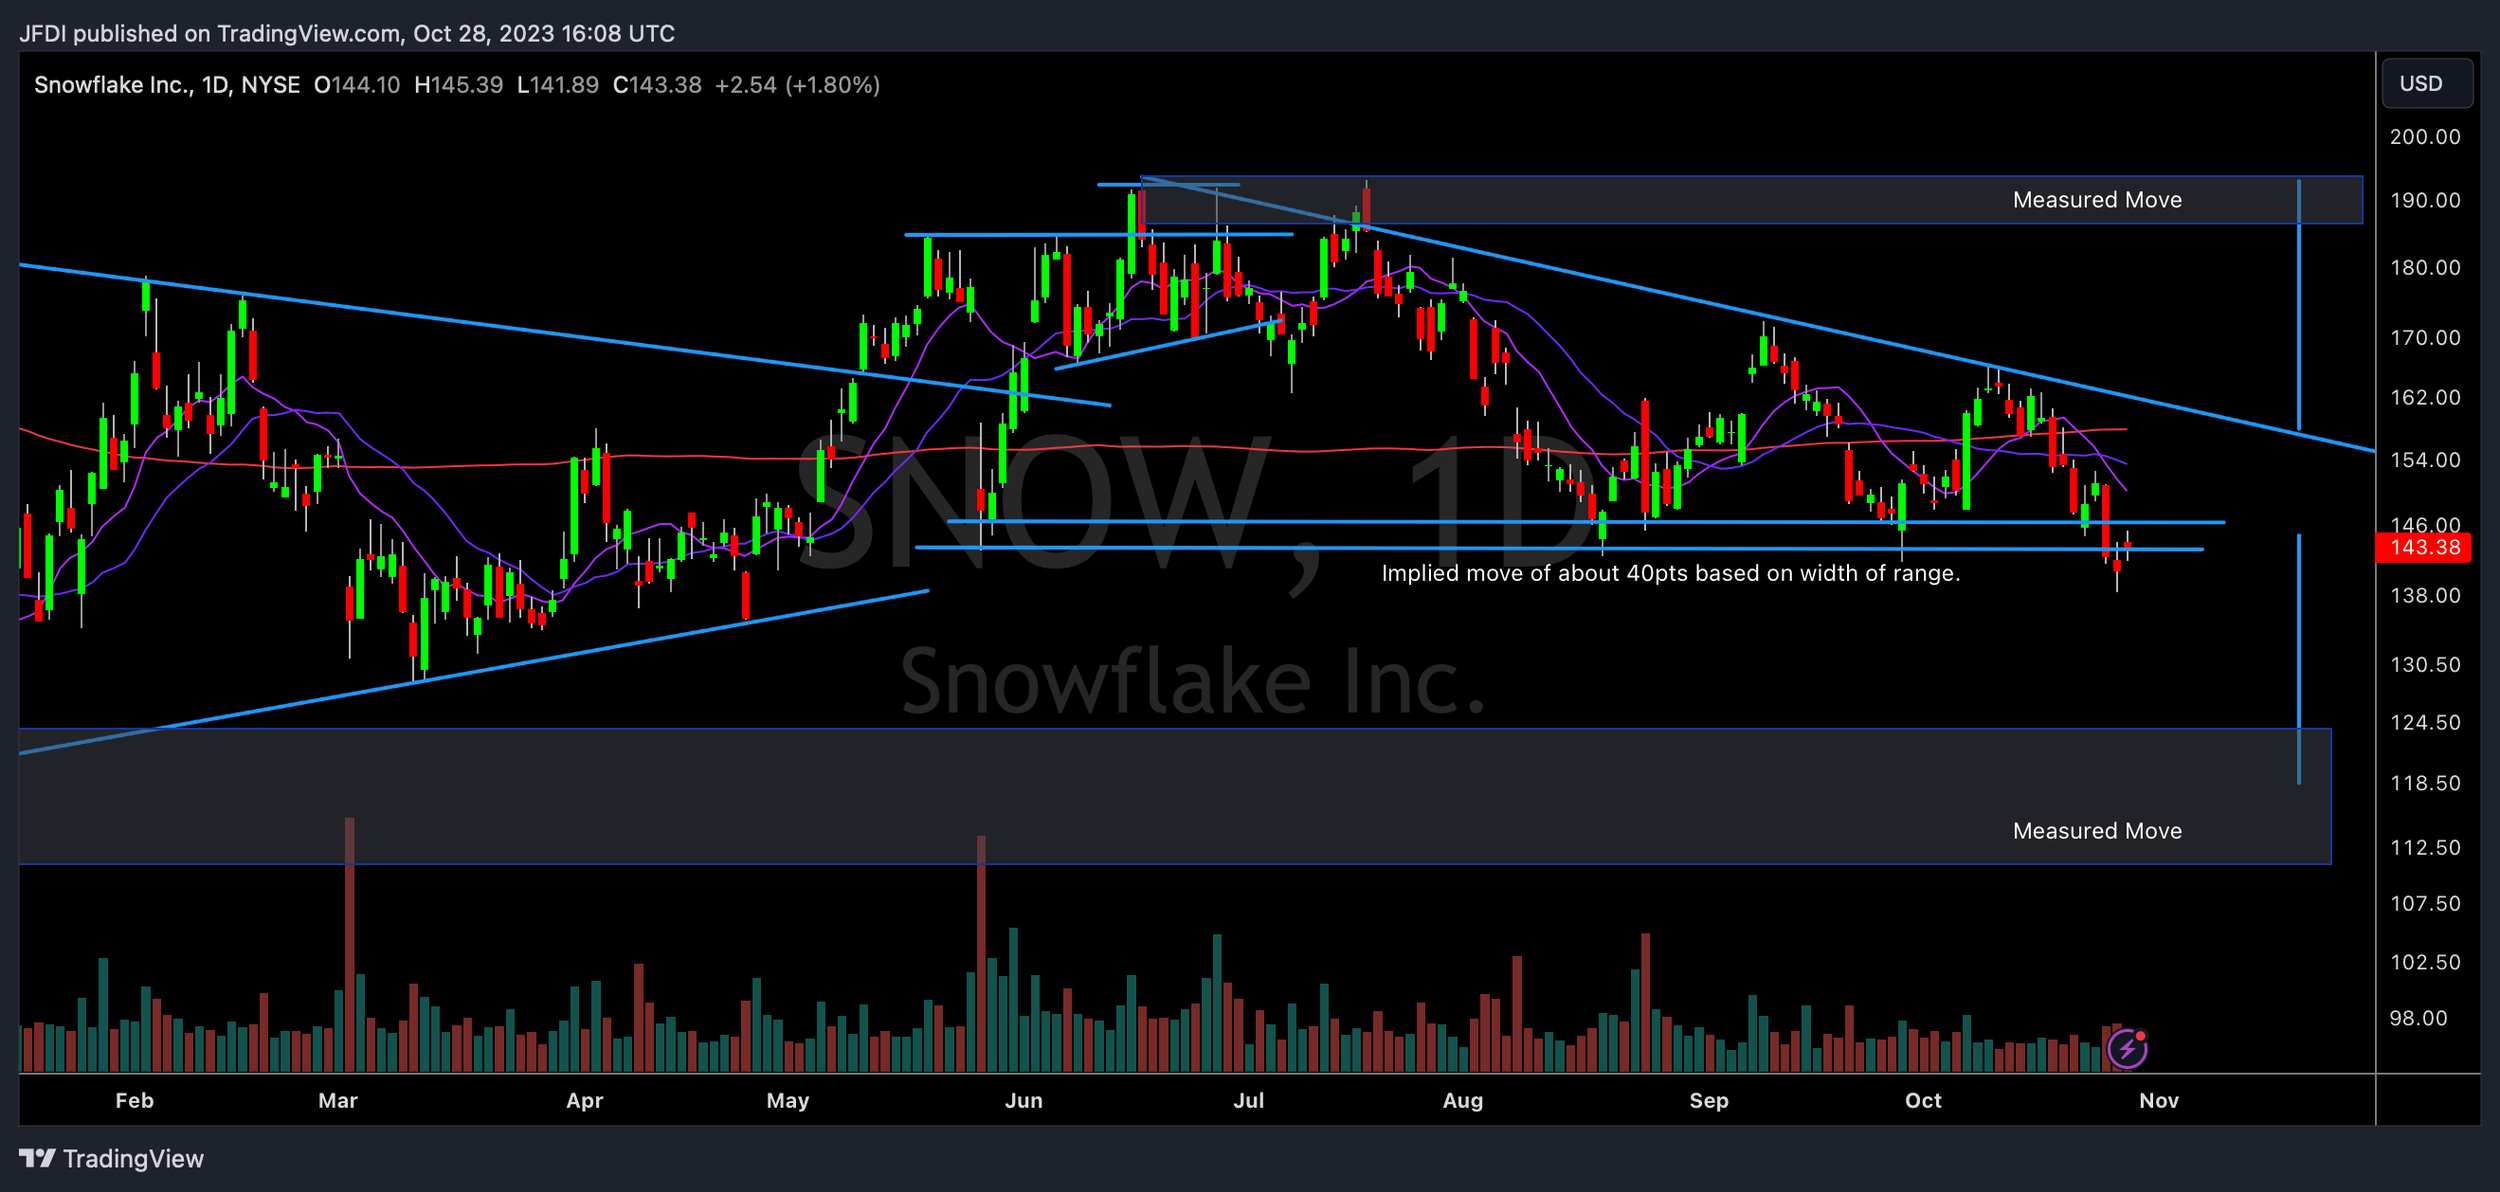
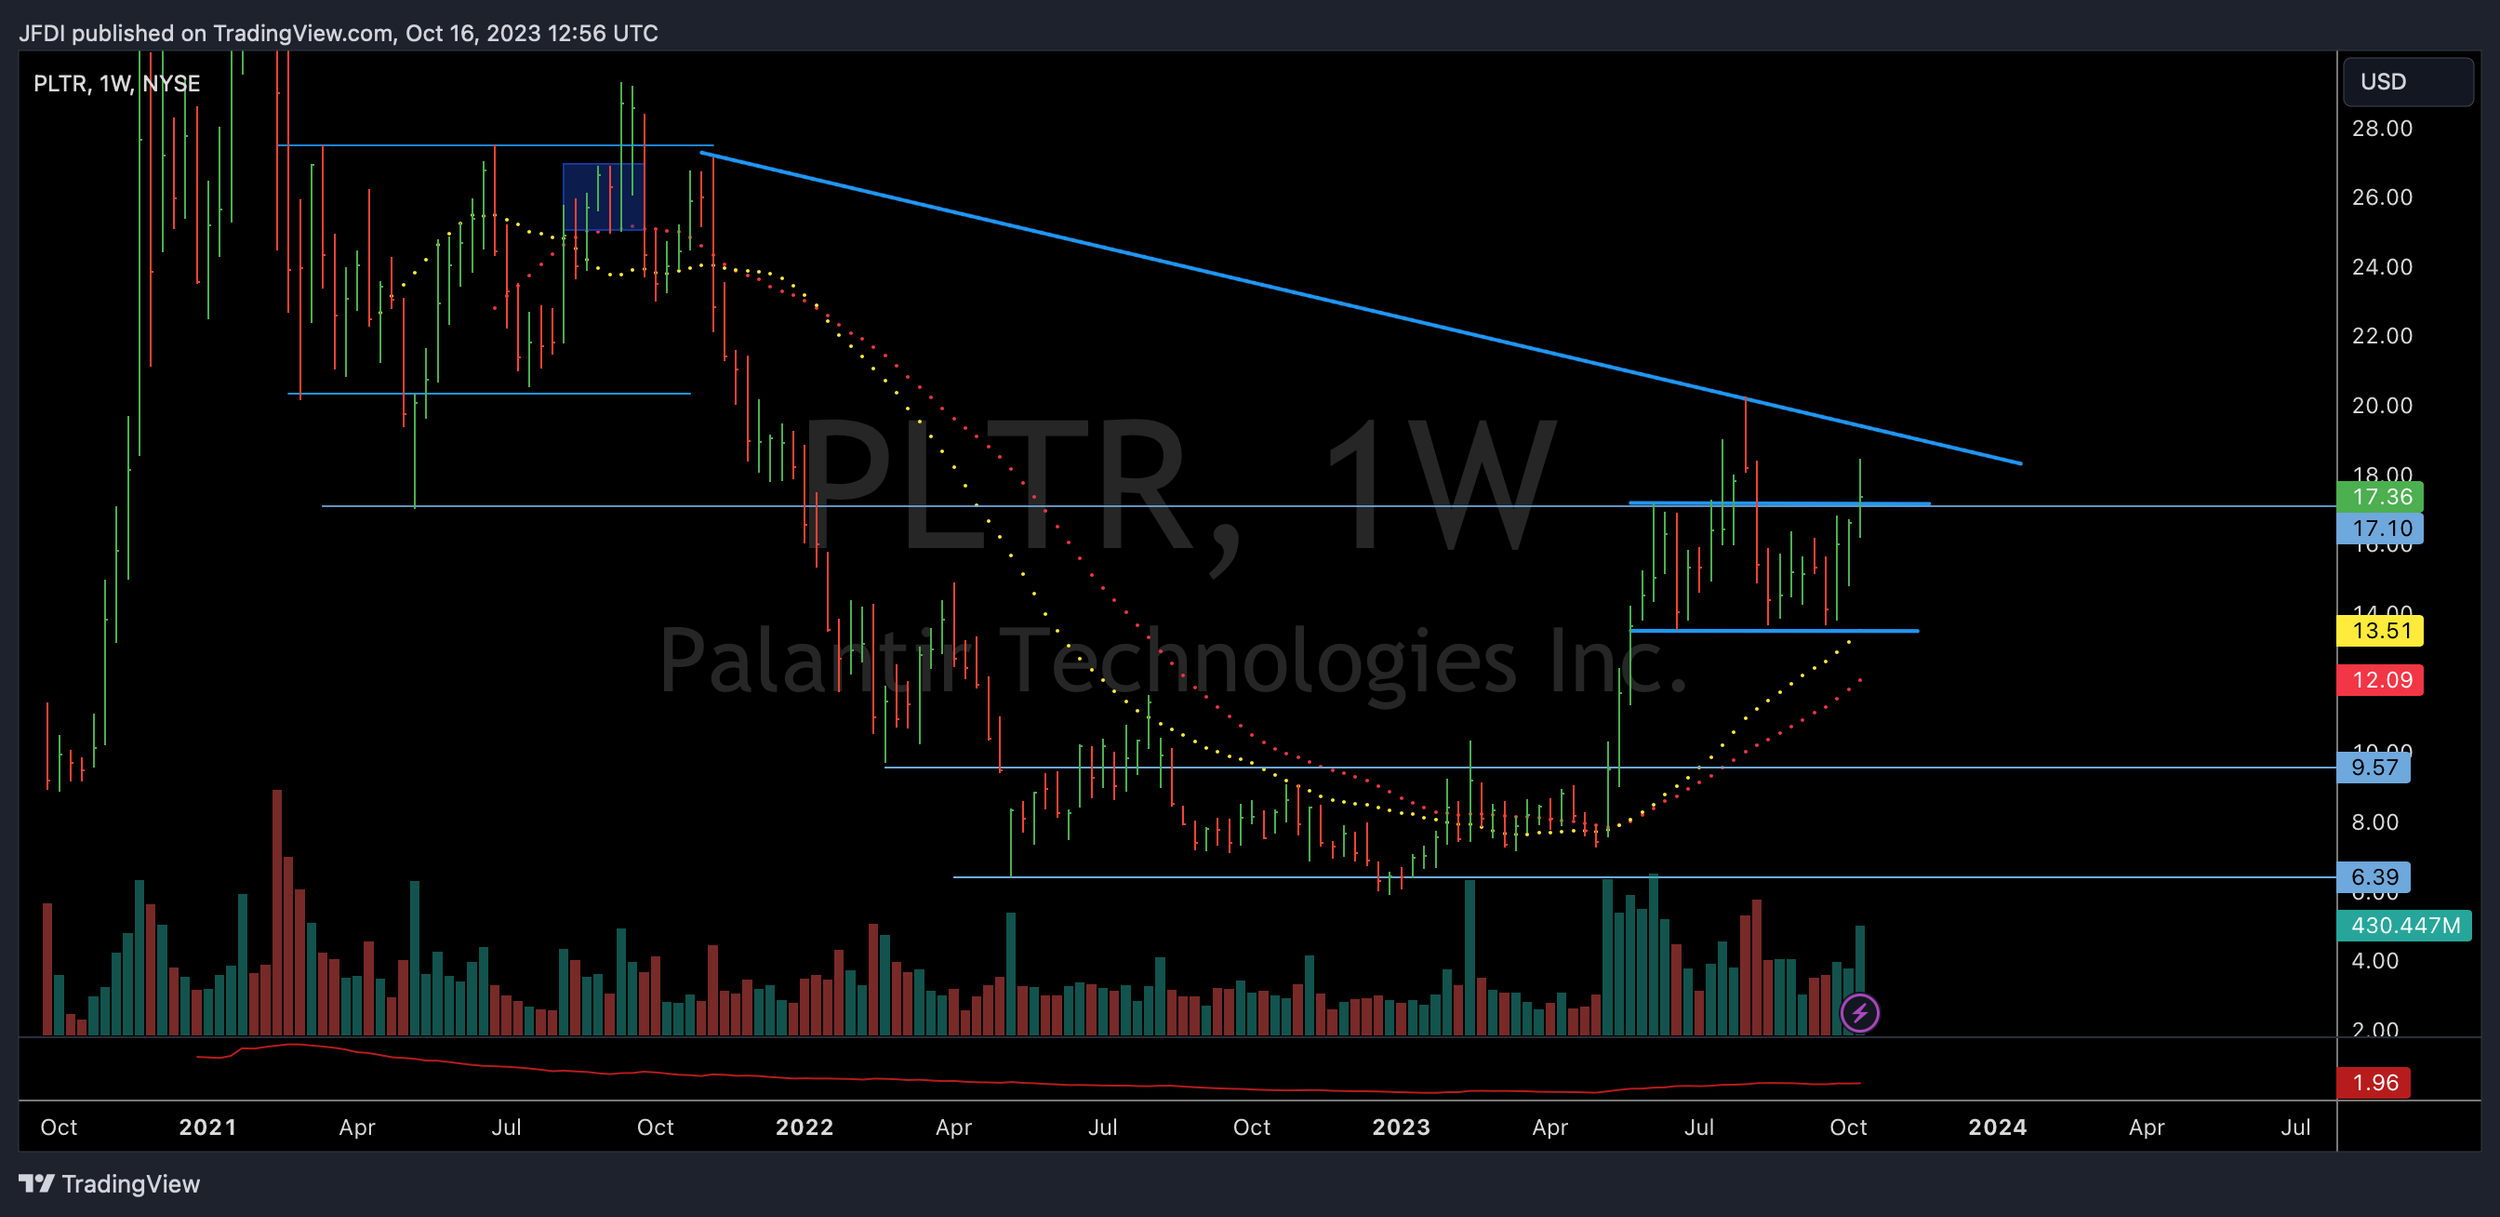
Snow Weekly - Stage 1 Breakout
Catch me live on Holding Bags show Tuesday Noon EST &
The Stocktwits Community Rip Wednesday at 2pm EST.
LIVE FEARLESS, NOT RECKLESS.
Curious about working with me or would like to connect? Give me a shout, anytime. Here


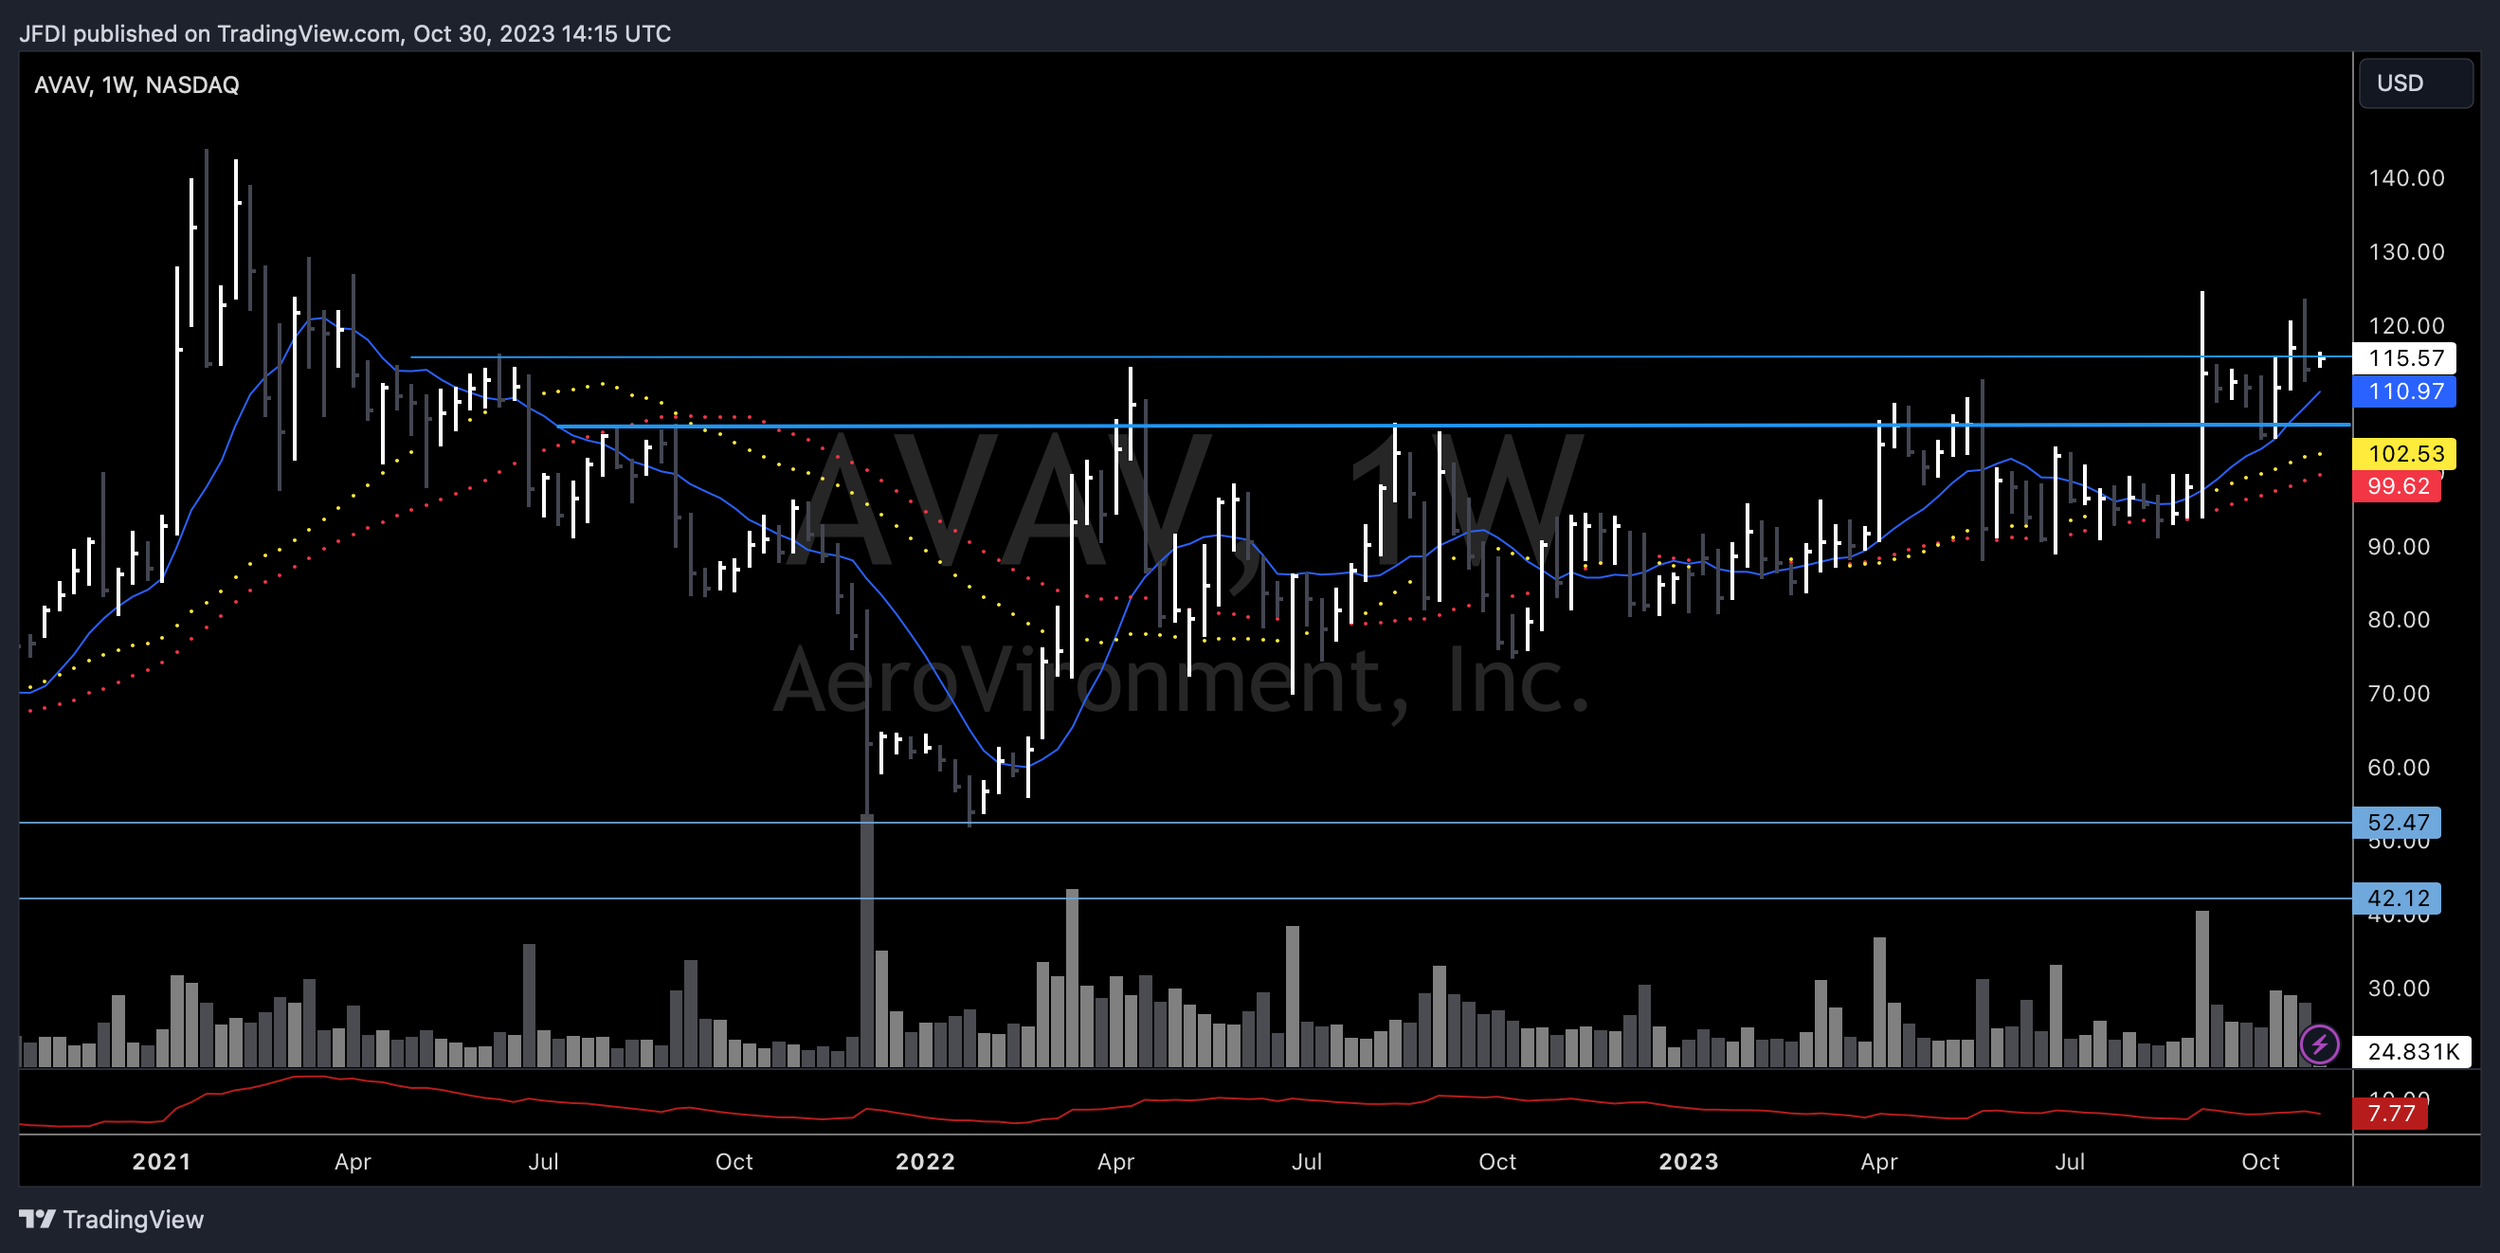
Charts of Interest - LMT KTOS AVAV
The game taught me the game. And it didn’t spare me rod while teaching.


Be fearless, not reckless.
Charts of Interest - NVDA SMCI

Daily H&S with a Measured move nears its 200dma

Trade Fearlessly, Not Recklessly.

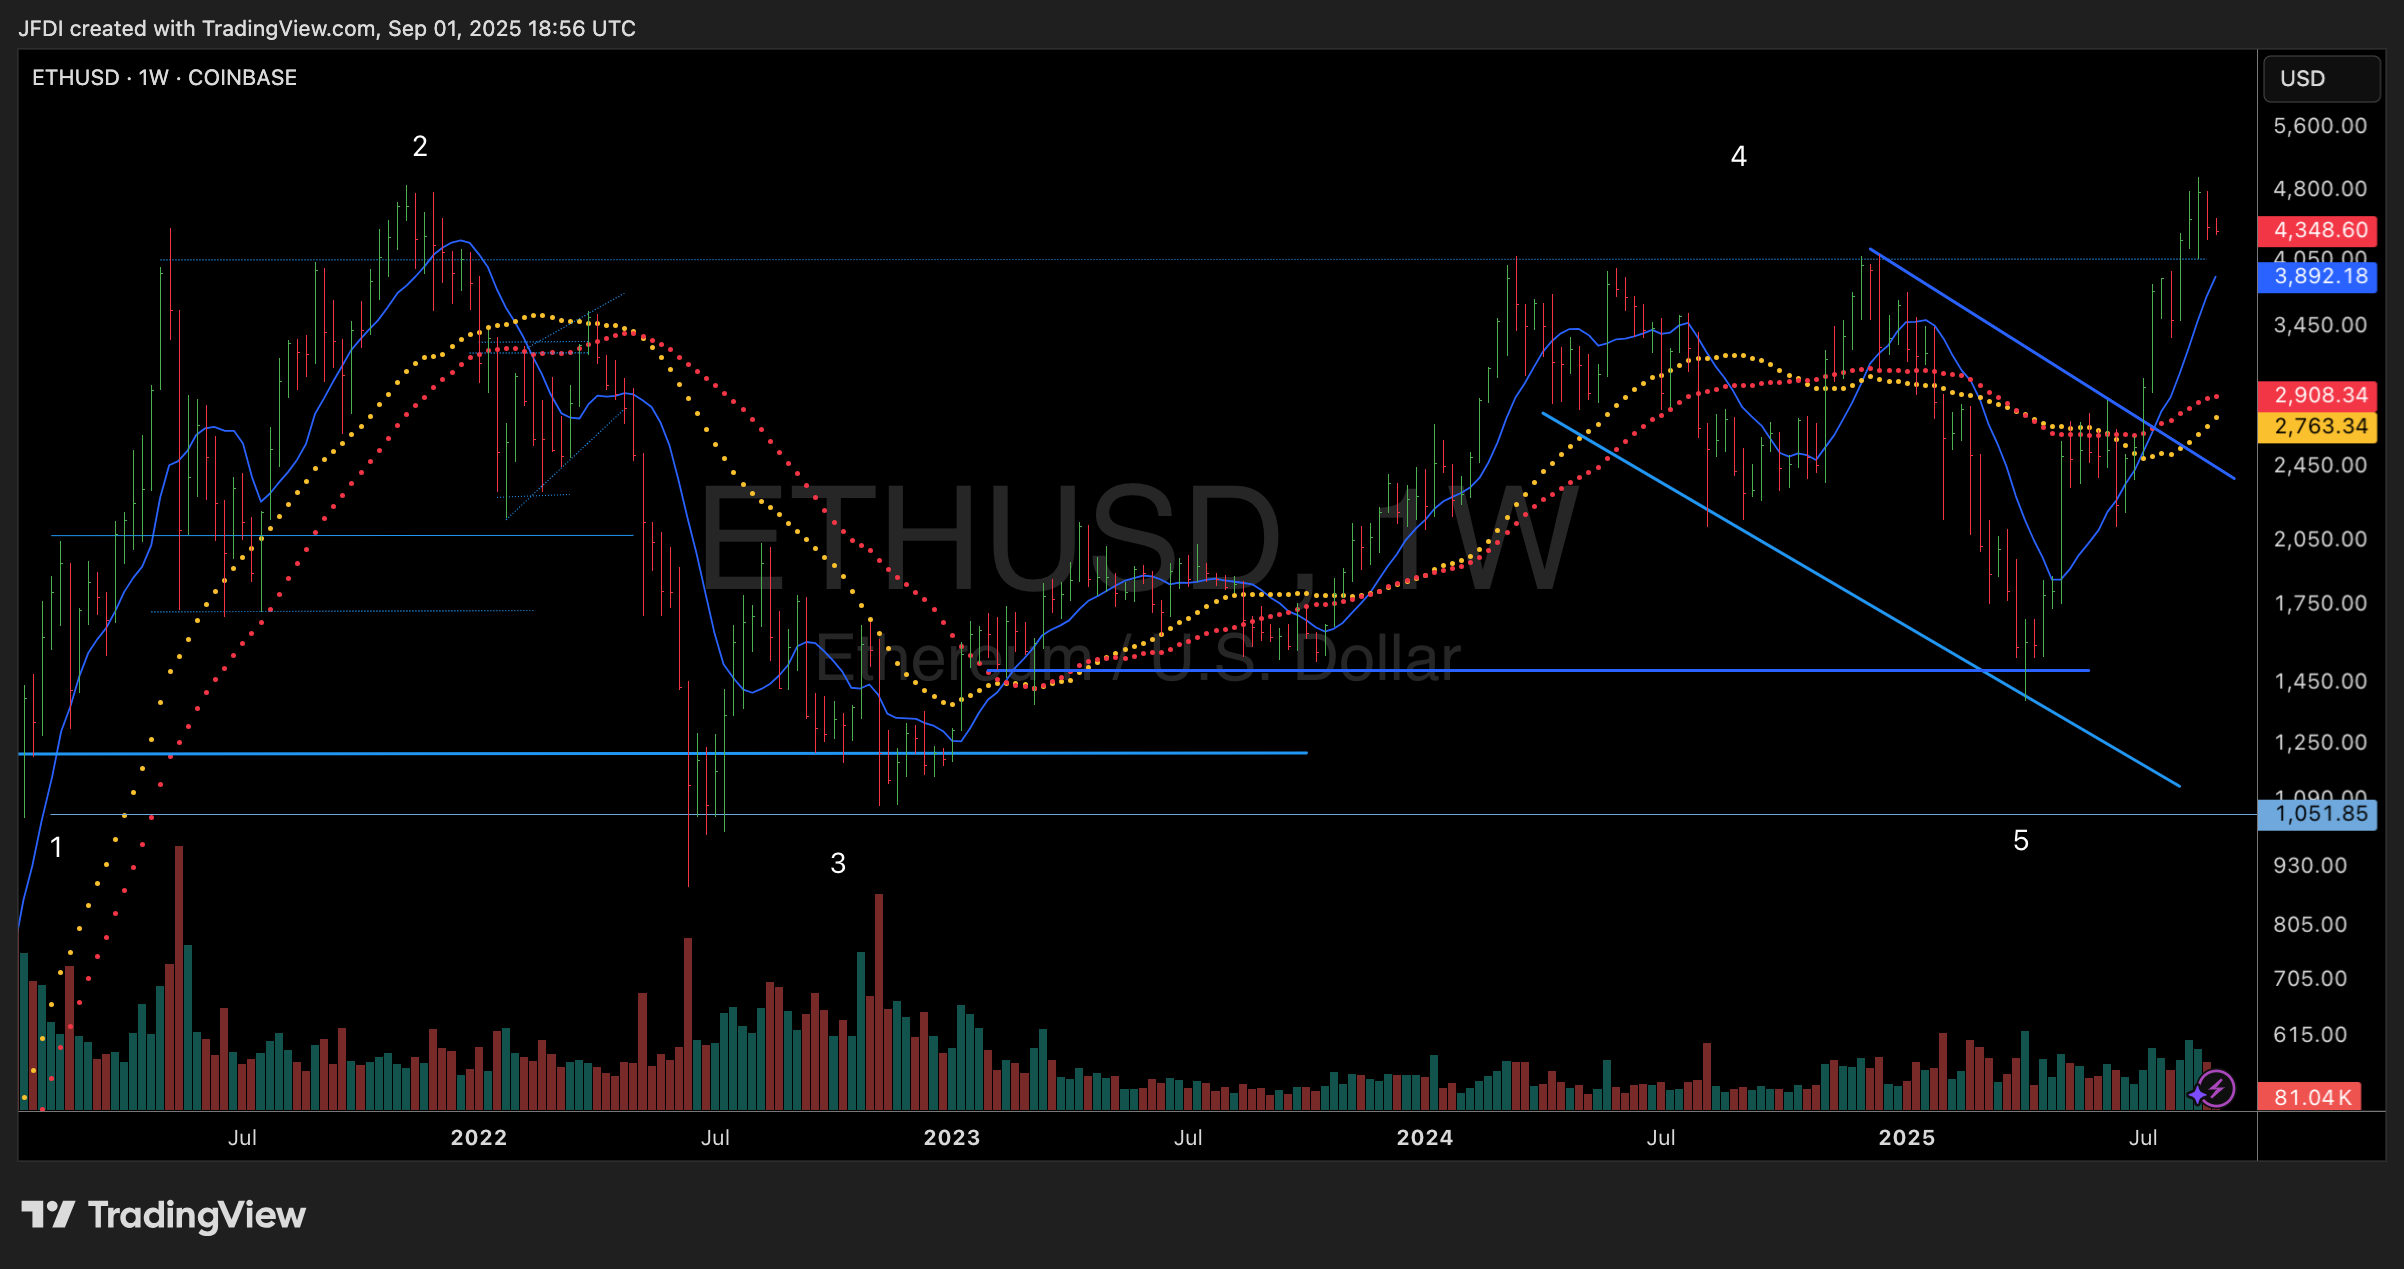
Charts of Interest
$GLD $DXY $QQQ $XLE $BTC.X
The unsuccessful investor is best friends with hope, and hope skips along life’s path hand in hand with greed when it comes to the stock market. Once a stock trade is entered, hope springs to life. It is human nature to be positive, to hope for the best. Hope is an important survival technique. But hope, like its stock market cousin’s ignorance, greed, and fear, distorts reason. See the stock market only deals in facts, in reality, in reason, and the stock market is never wrong. Traders are wrong. Like the spinning of a roulette wheel, the little black ball tells the final outcome, not greed, fear or hope. The result is objective and final, with no appeal.


Trade Fearlessly, Not Recklessly.


Charts of Interest - XLE
No matter how great & powerful you are, if you have not conquered your mind you are a slave.

XLE Monthly

XLE - Weekly stair stepping higher.

USO Monthly Look

USO Weekly

DVN Daily - Breaking higher out of range.

OXY Daily - Breaking higher on Friday.
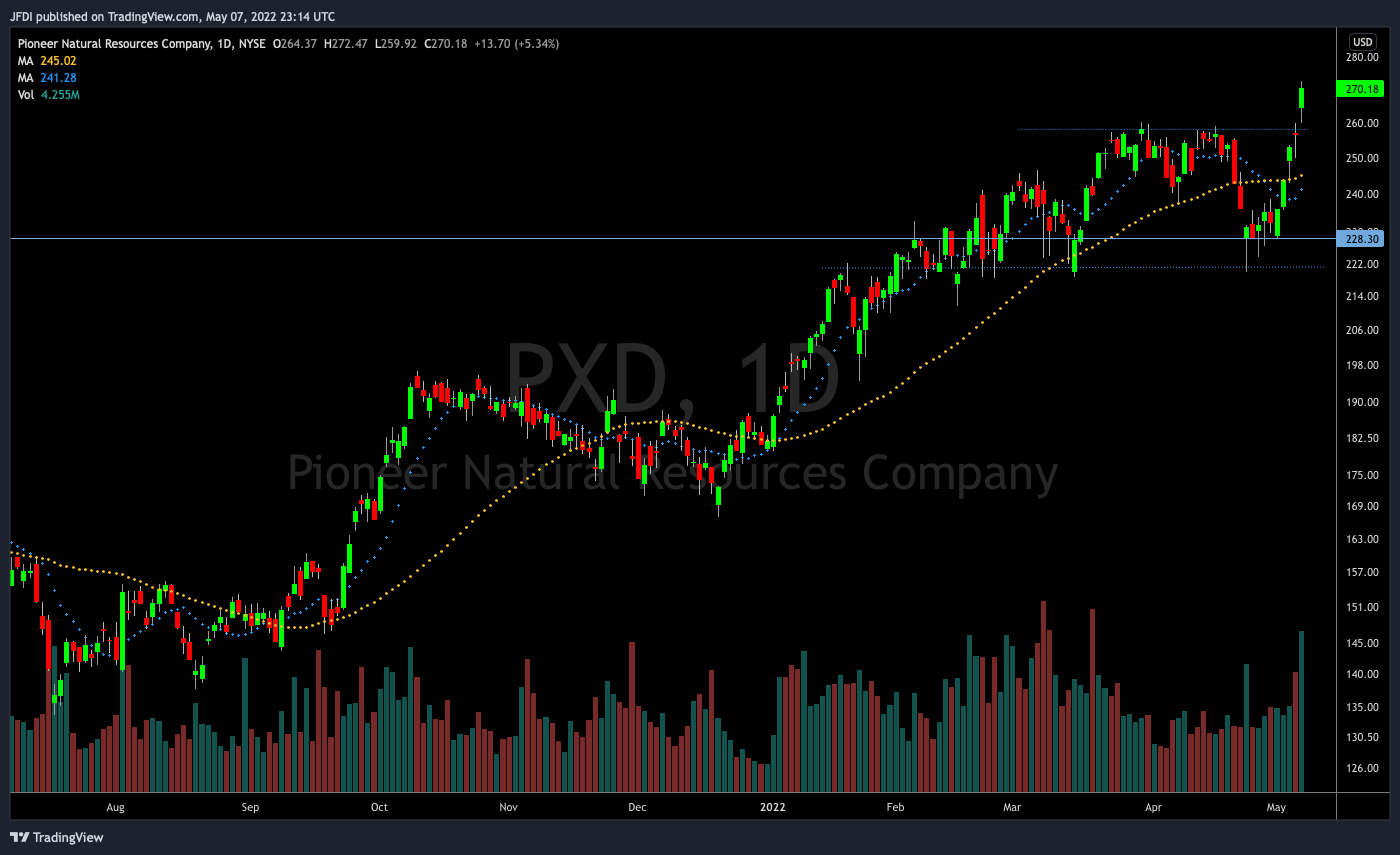
PXD Daily - Broke higher Friday into all time highs on huge volume.

EOG Daily - Also broke higher into all time highs on Friday on above average volume

XOM Daily Chart - Still under ATH’s, sitting near high end of this range. 100 likely act as a magnet. All time highs sitting at 104.75

INDO Daily Chart - 99RS Rating.

OVV Daily - w/98 RS rating. EPS due this week (5/10/22)

COP Daily - ATH’s on Friday.
Some other names of note:
APA
MUR
MRO
CVE
IMO
NFE
SU
EQT - 3wt
CVE
Charts of Interest - GLD SPY QQQ
Hold yourself accountable before you are held accountable

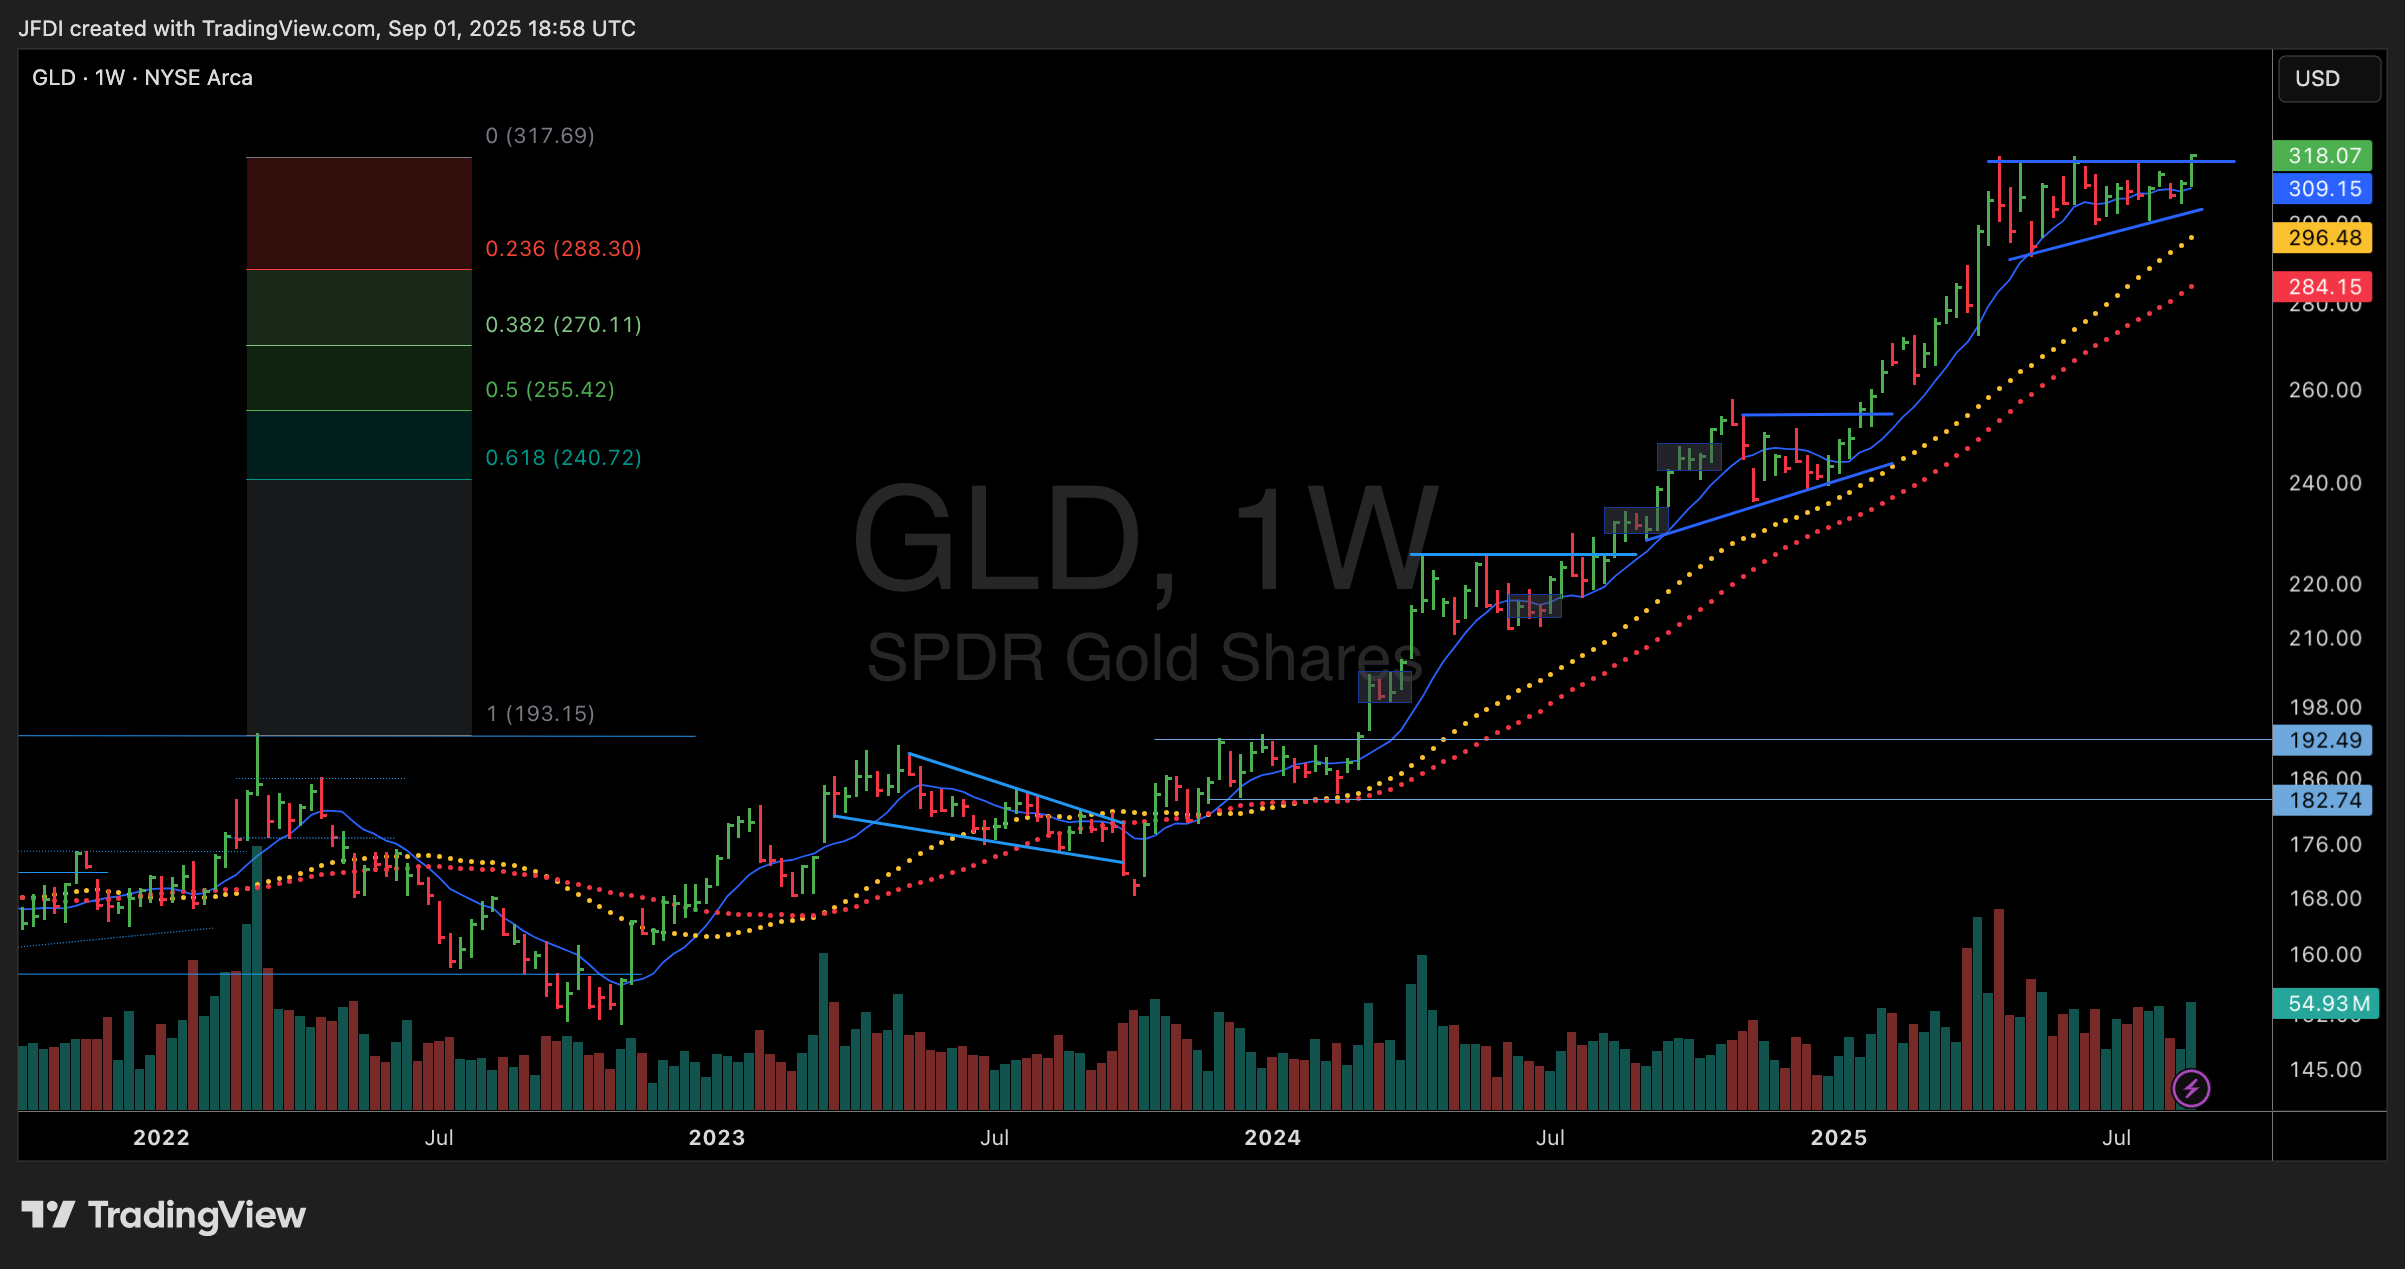
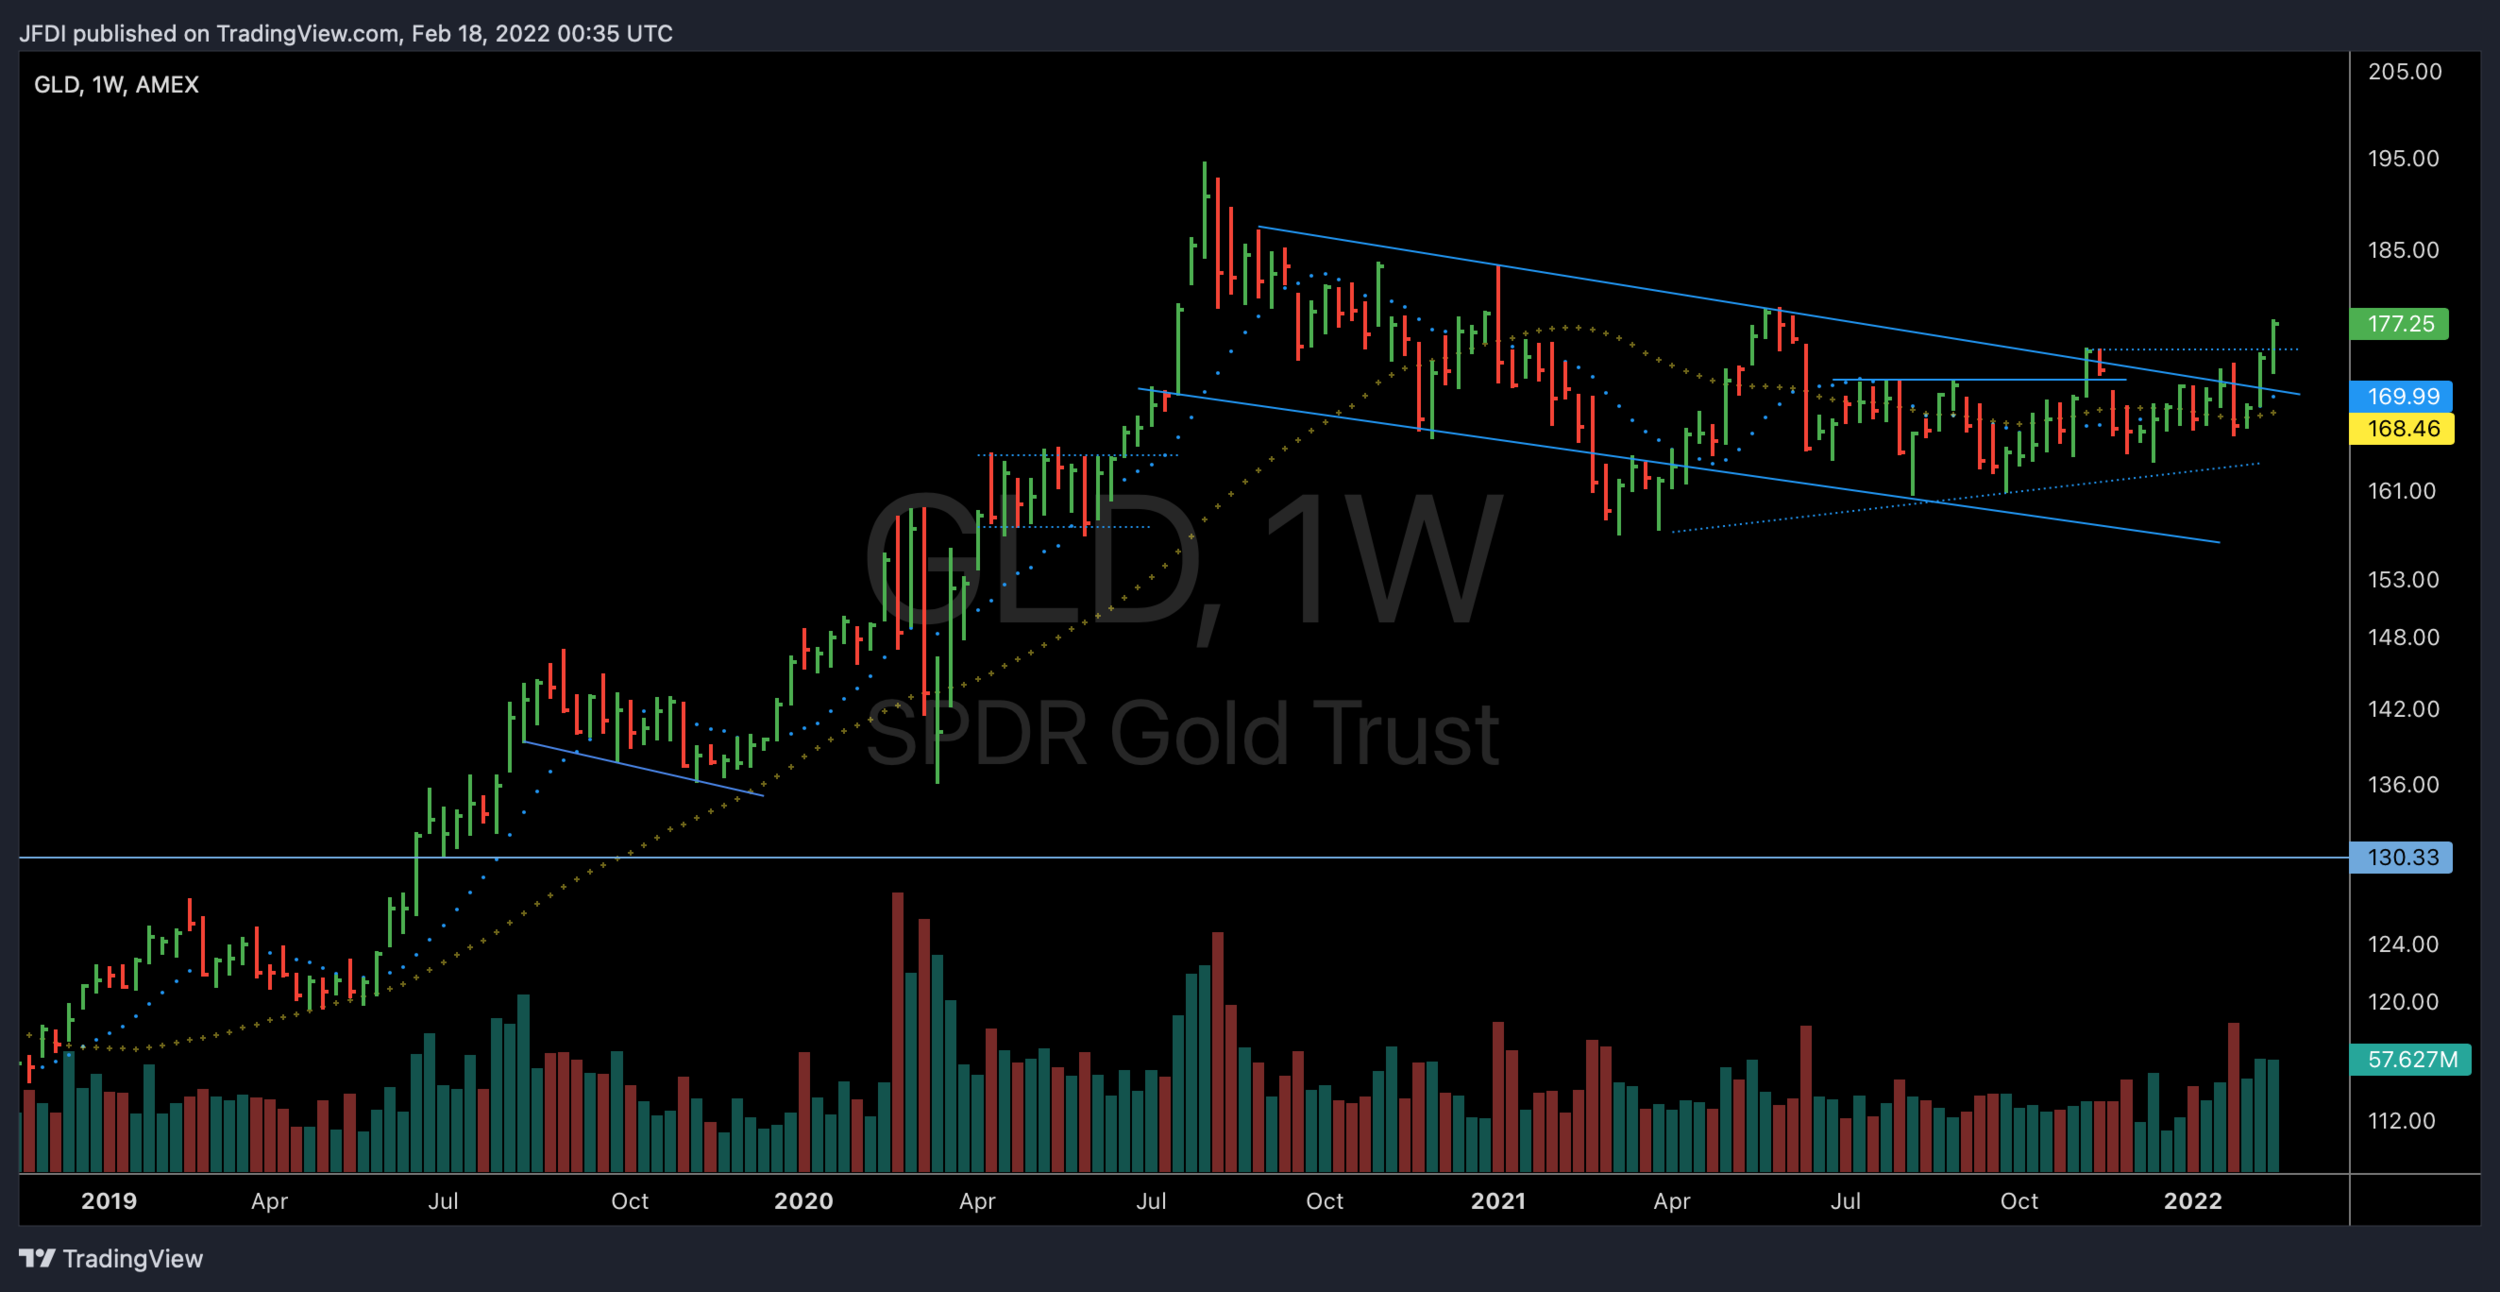
GLD Monthly Chart - Bullish as long the GLD holds above 160. Ideally, Holds here above 169.

SPY Daily Chart - Has a near term Measured Move around 395.

SPY Weekly - A 50% retracement from the 2019 break out sits at about 380ish. A breach of that would likely send the S&P much lower. The 4yr moving average which the SPY has held/bounced off since the beginning of this bull run beginning in 2011 sits around 345/350. I am in the camp that SPY bottoms out and holds between that 350 & 380 area. Since breaking above in 2011 we have seen 4 touches of the 4yr moving average, which is the 200period MA on the weekly.
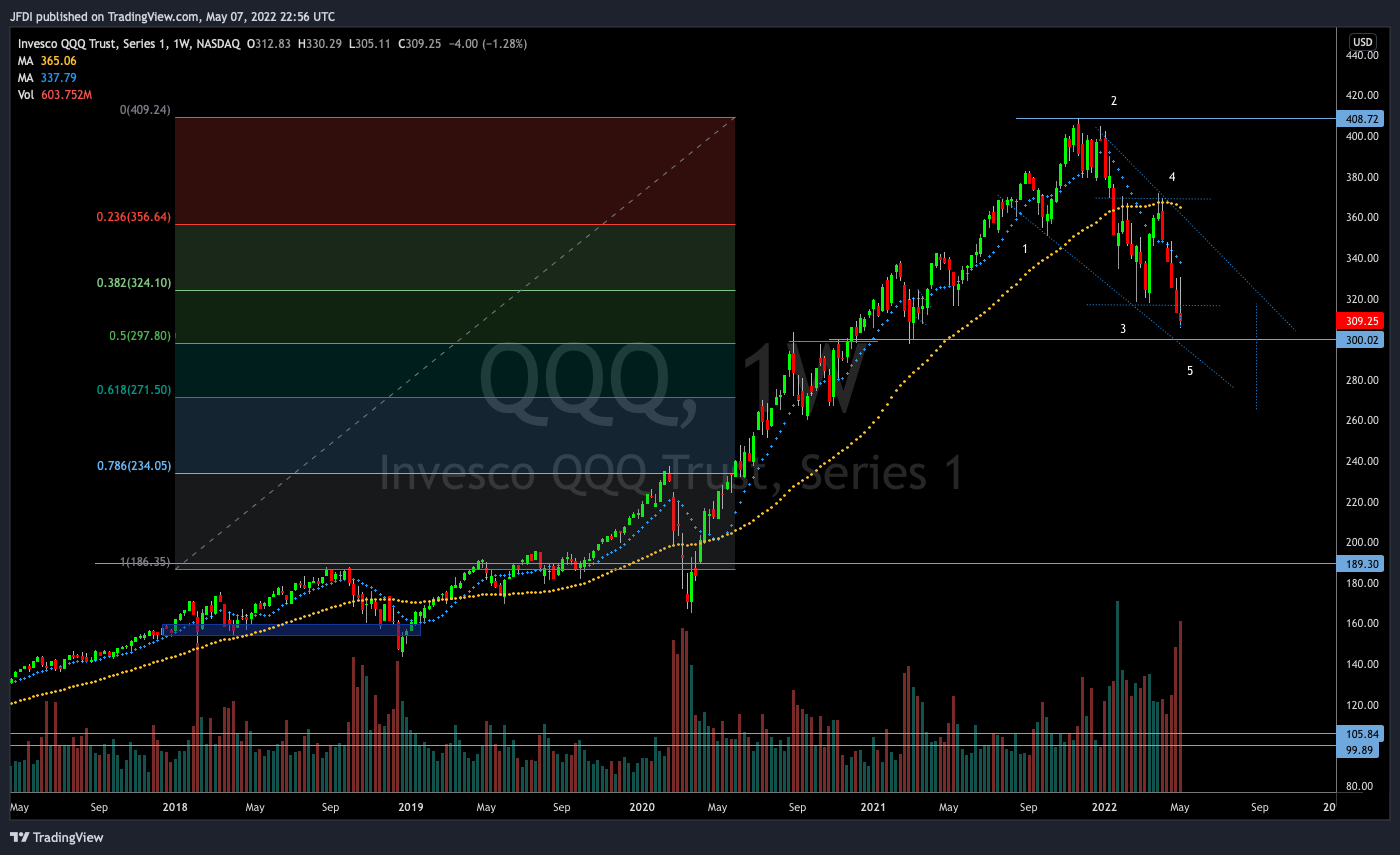
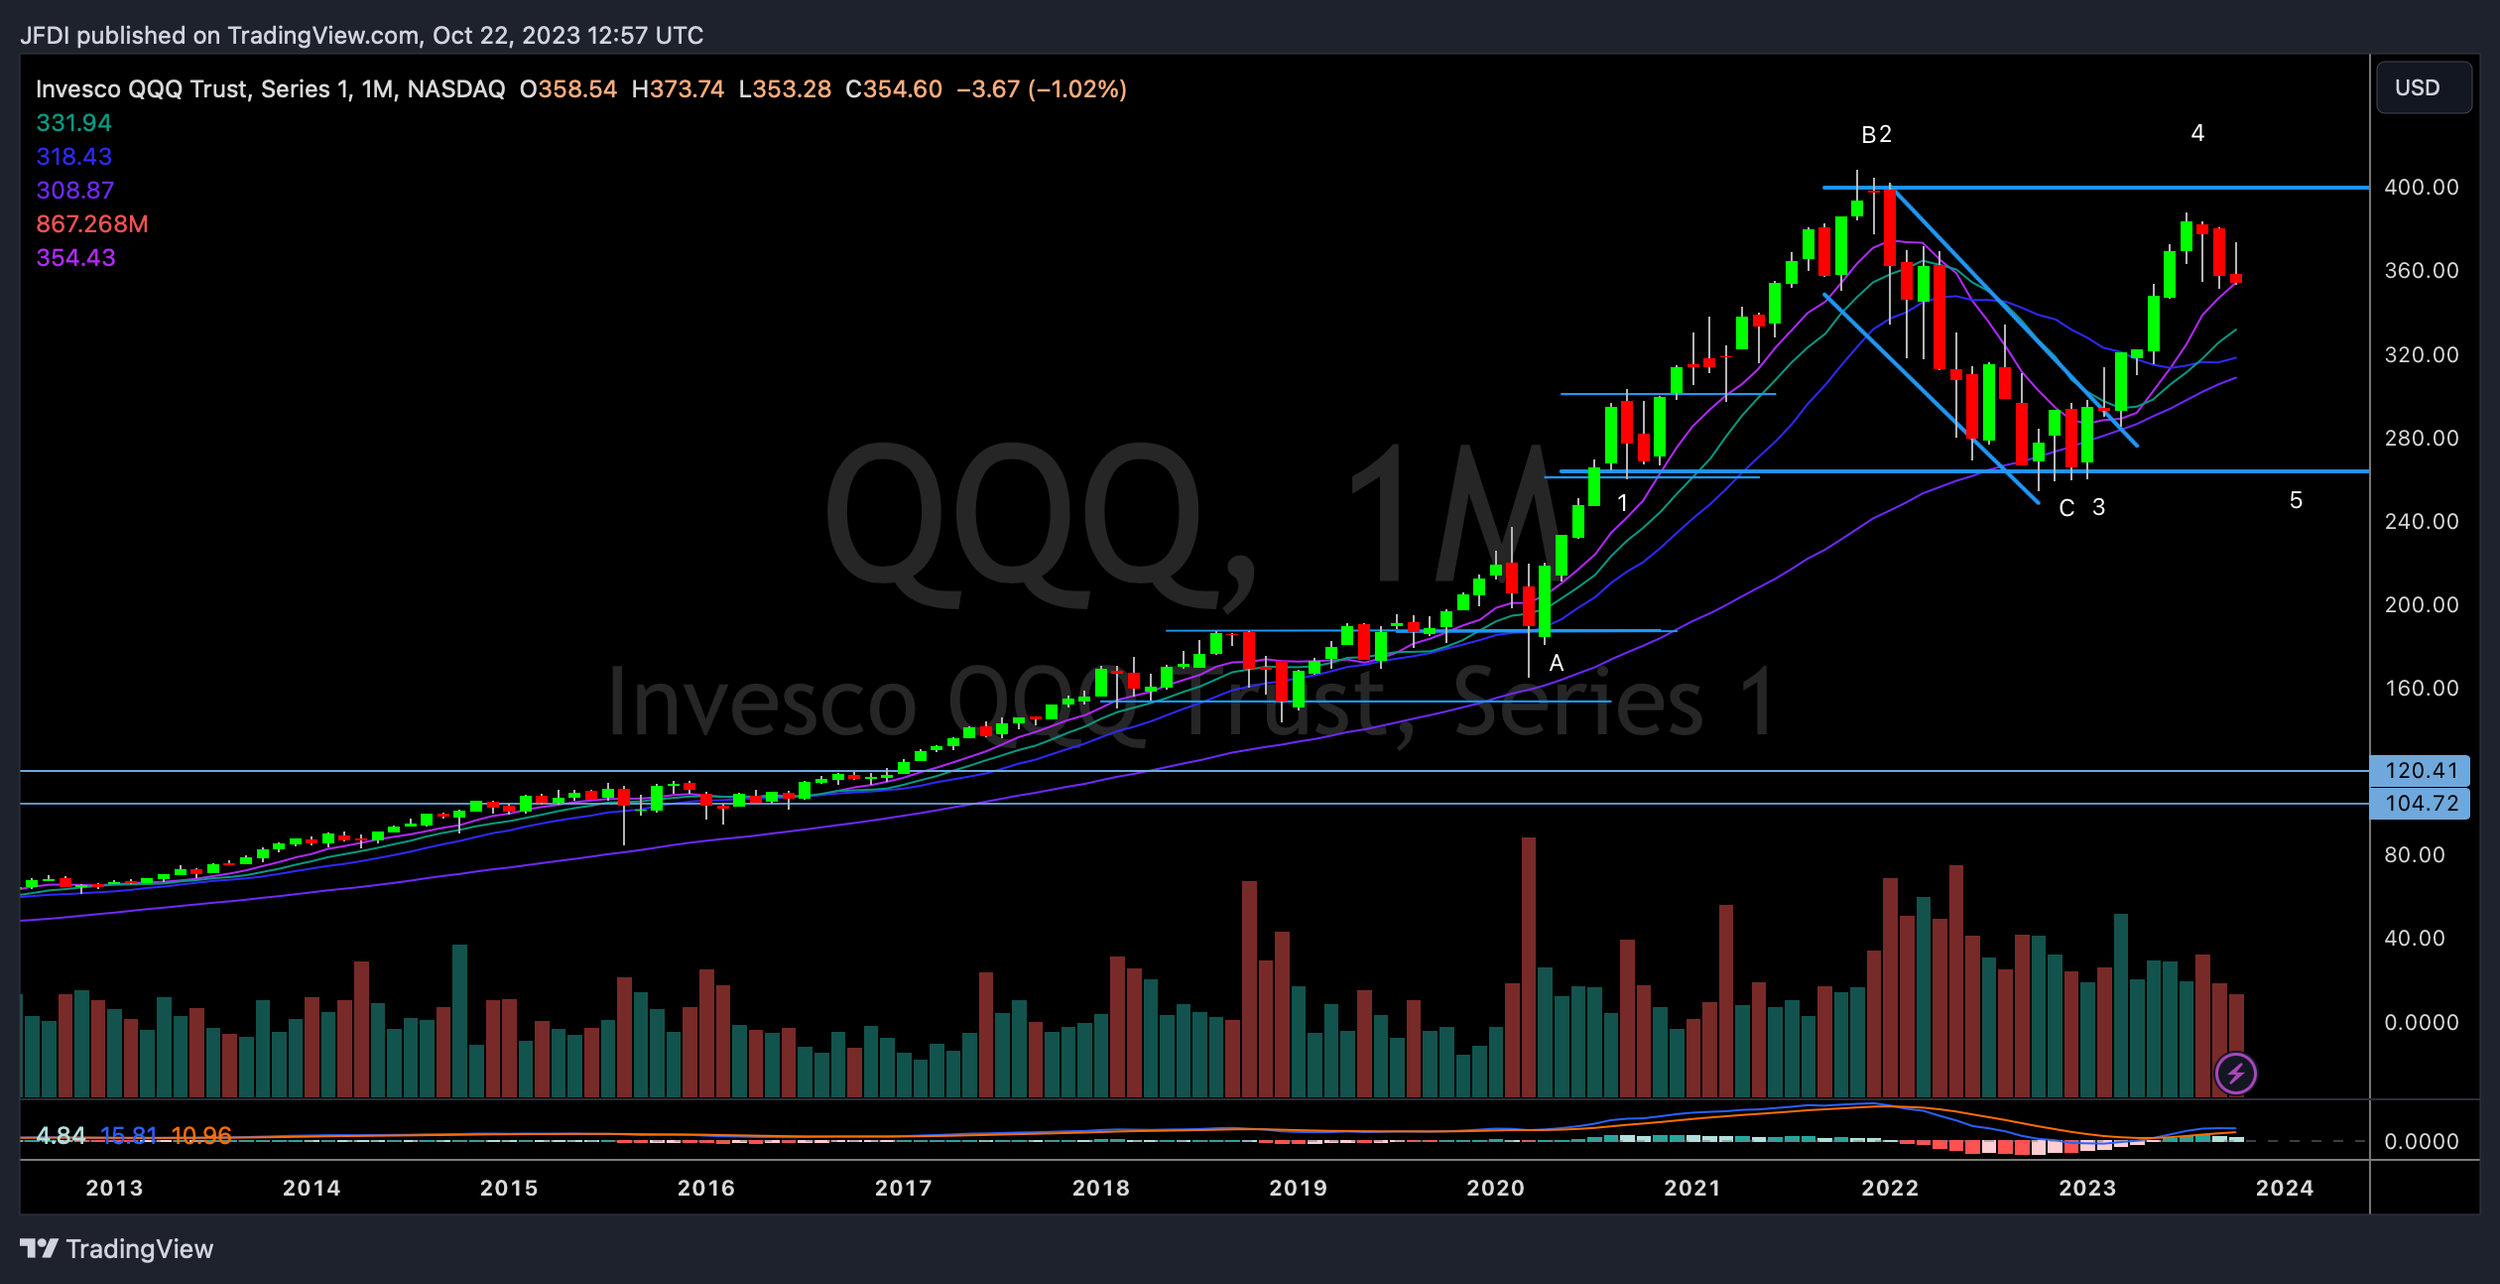
Similar to the SPY. This is the QQQ weekly. The 50% retracement from the 2019 b/o sits just under 300. Currently, looks like that 300 is a magnet, not sure that it holds. Ideally, would like to see the QQQ hold above .618 (270ish). The 4yr MA is sitting roughly at 260 currently. There is a lot of confluence in that area 260/270 zone.


Charts of Interest
Pay attention to your patterns.
The ways you learned to survive may not be the ways you want to continue to live.
Heal and shift.


“When you have a strong magnetic force of gratitude, like magic, you automatically magnetize everything you want and need to you!”