
Hold yourself accountable before you are held accountable

GLD Monthly Chart - Bullish as long the GLD holds above 160. Ideally, Holds here above 169.

SPY Daily Chart - Has a near term Measured Move around 395.

SPY Weekly - A 50% retracement from the 2019 break out sits at about 380ish. A breach of that would likely send the S&P much lower. The 4yr moving average which the SPY has held/bounced off since the beginning of this bull run beginning in 2011 sits around 345/350. I am in the camp that SPY bottoms out and holds between that 350 & 380 area. Since breaking above in 2011 we have seen 4 touches of the 4yr moving average, which is the 200period MA on the weekly.
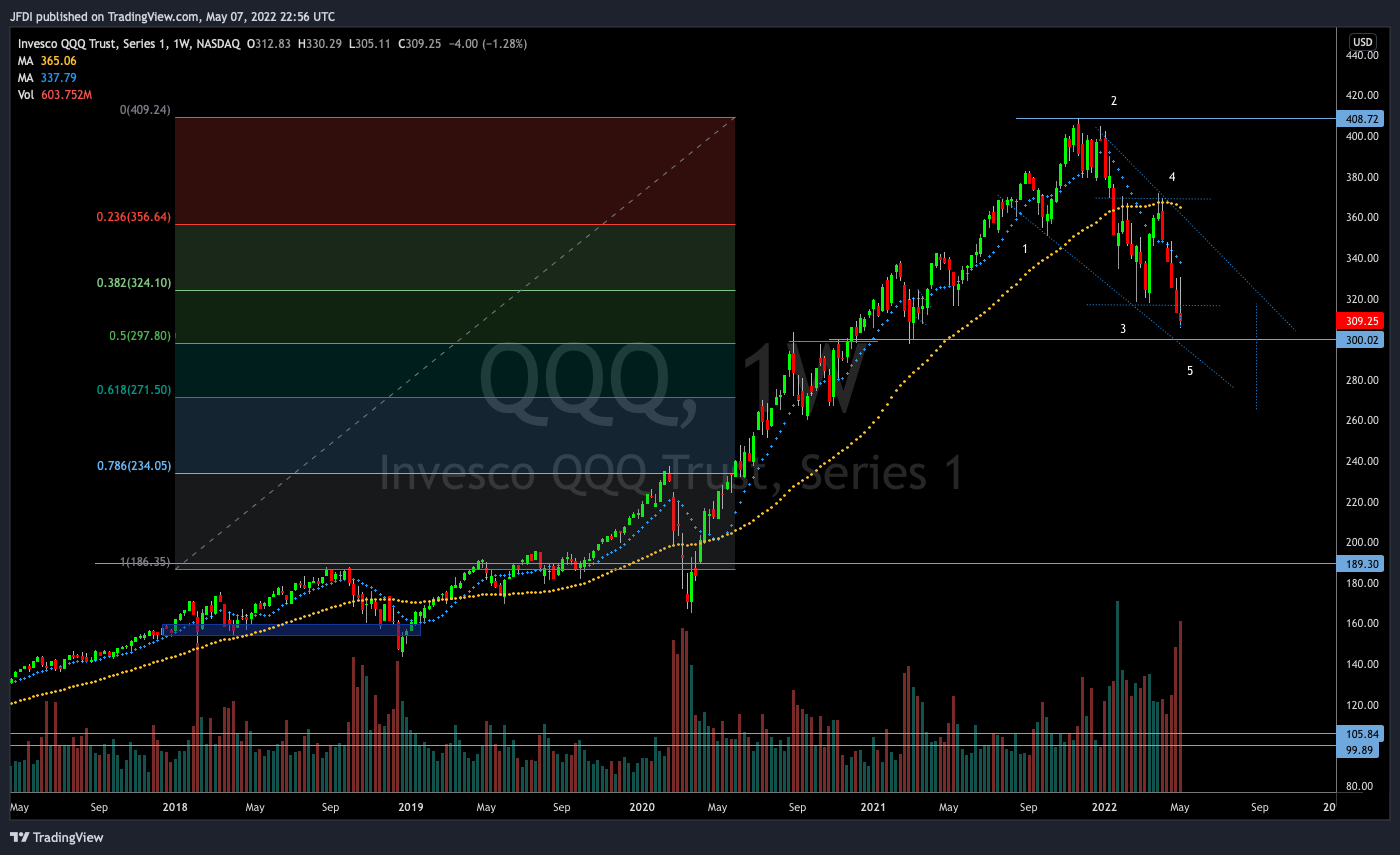
Similar to the SPY. This is the QQQ weekly. The 50% retracement from the 2019 b/o sits just under 300. Currently, looks like that 300 is a magnet, not sure that it holds. Ideally, would like to see the QQQ hold above .618 (270ish). The 4yr MA is sitting roughly at 260 currently. There is a lot of confluence in that area 260/270 zone.