

Weekly
MJ

$SPY

Current

SPY 2007
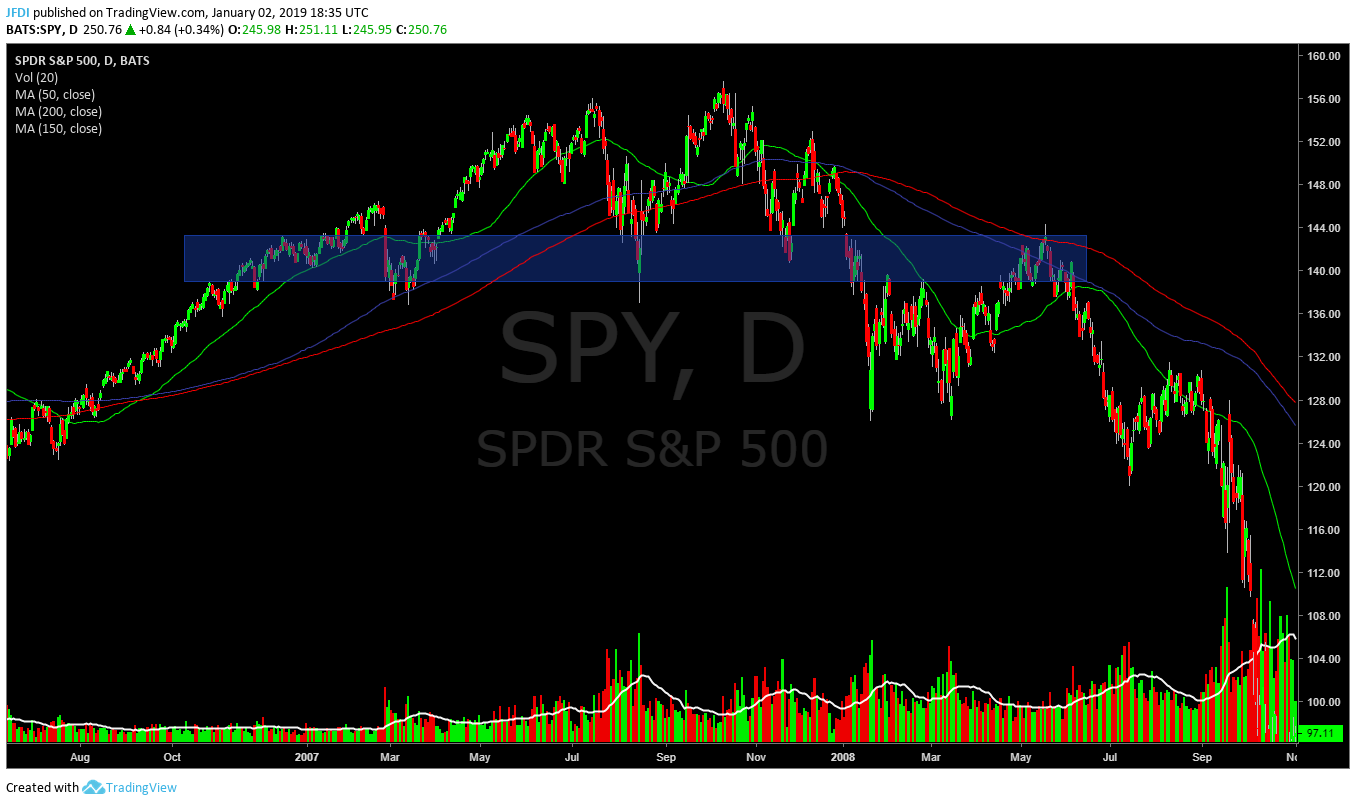
SPY 2007
Charts of Interest - $SPY $QQQ $IWM

IWM Monthly

IWM Weekly

QQQ Monthly

QQQ Weekly

SPY Monthly
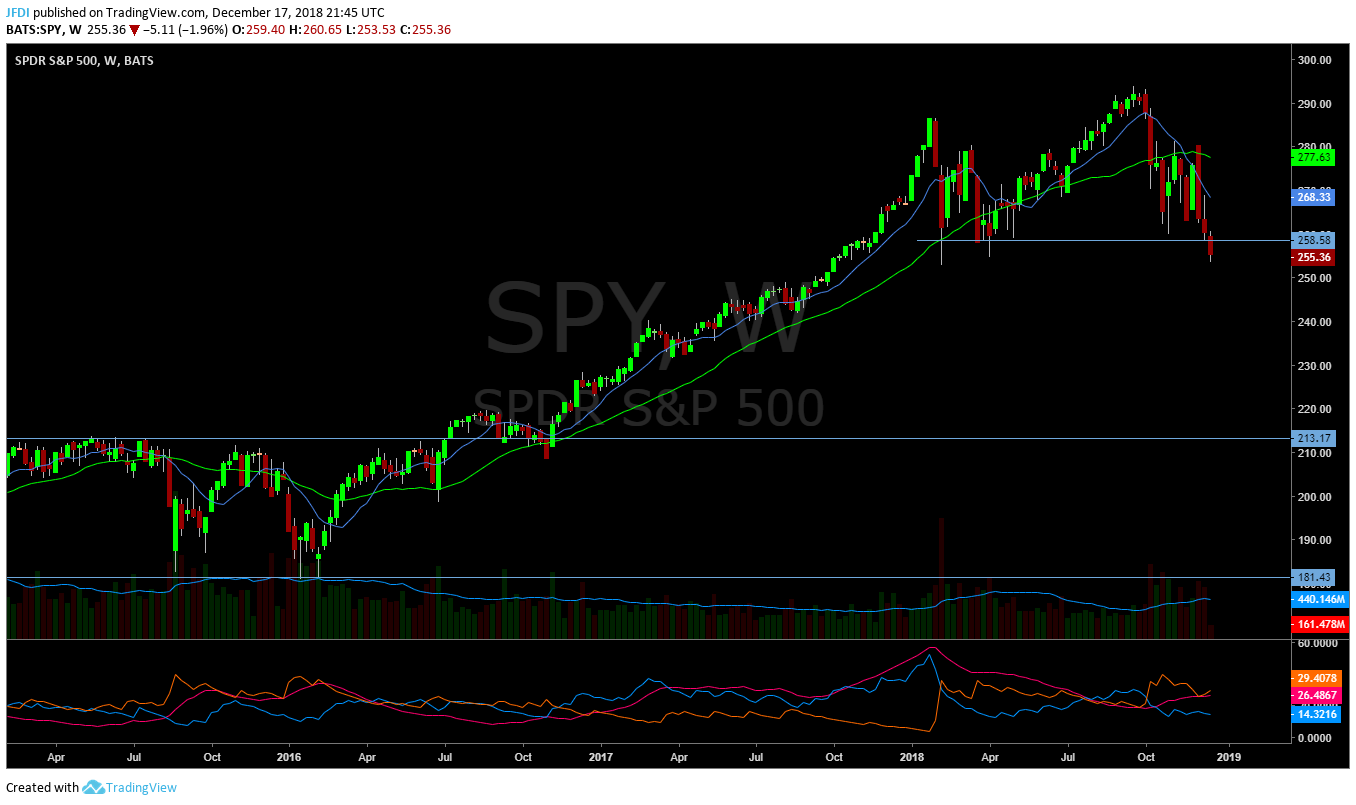
SPY weekly
Charts of Interest - $GLD $KL $GOLD

Monthly look at the GLD. Holding long term trend line

Daily look at $KL

Daily Look at $GOLD
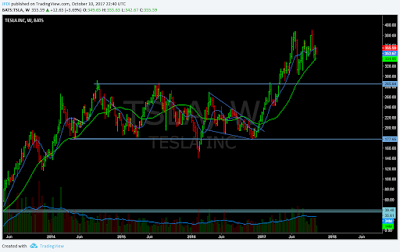
$TSLA Weekly View

$TSLA Charts & Stuff. What are your thoughts?
Musk photo found on the web
Look at that giant inside bar.
Several attempts at that 350-380 area. But still has held within range.

I drew some half circles, lines. Colored it a bit... . Inverse H&S? Ha.
Daily Descending wedge. I believe that low vol highs/lows love to be tested. Wouldn't that sell off from early June highs, constitute as high volume high?
AH trading around 330ish. Would be interesting to see it open up in this area of convergence. 200d & a gap fill. Could be a spot they easily sell it off. Or gap and go?
$TSLA Squeezing Those Shorts...
Charts of Interest - $SPOT $IQ $HUYA
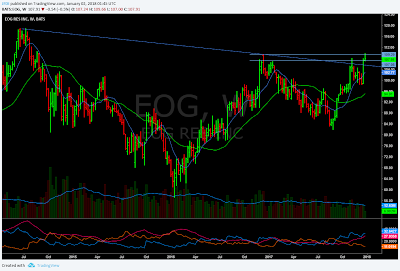
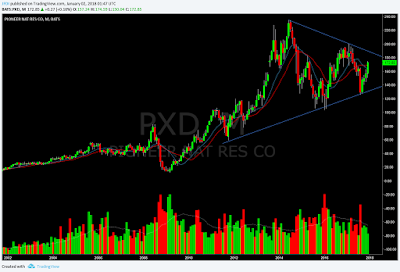
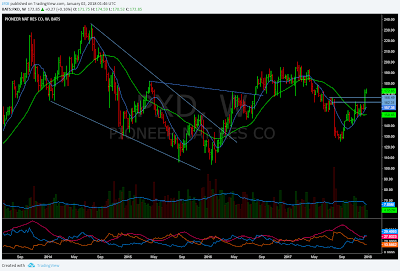
Charts of Interest - $EOG $FFIV $PANW $PXD $RGNX $SAGE $SUPN $BIDU
Charts of Interest - $SQ $PYPL
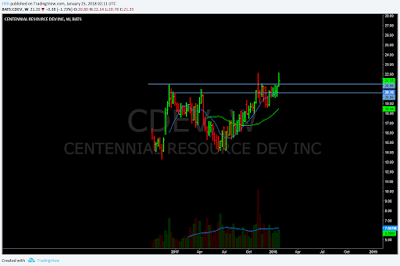
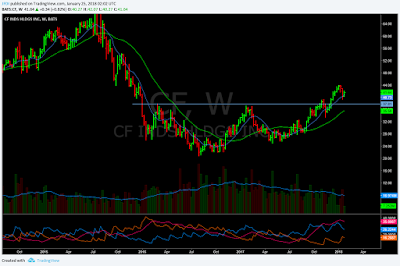
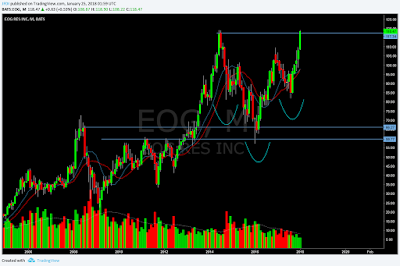
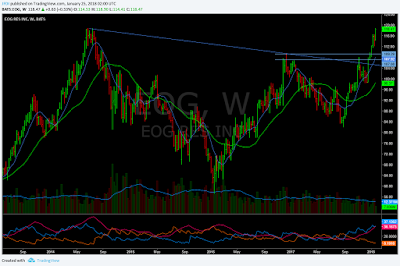
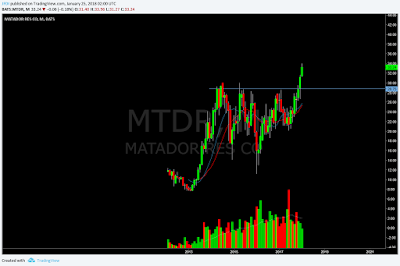
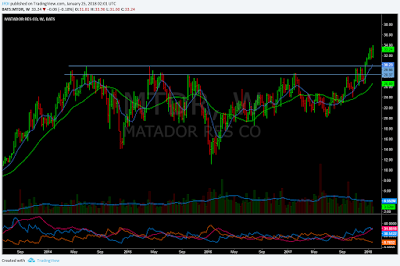
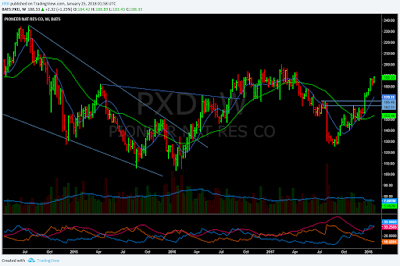
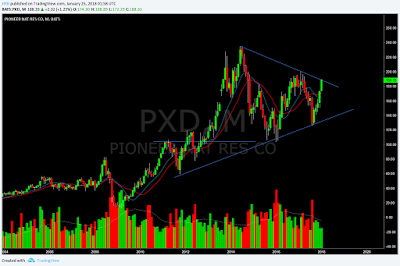
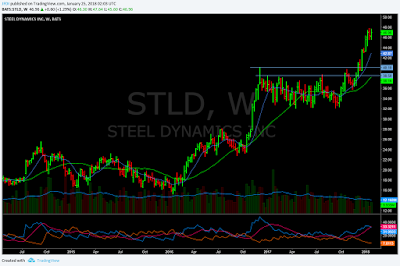
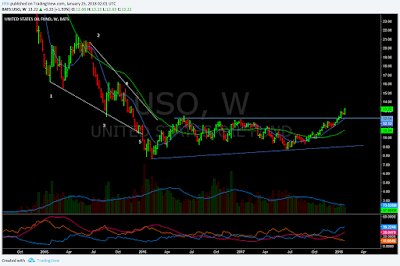
$CF $EOG $MTDR $PXD $STLD $USO $CDEV
$MON

$GLD

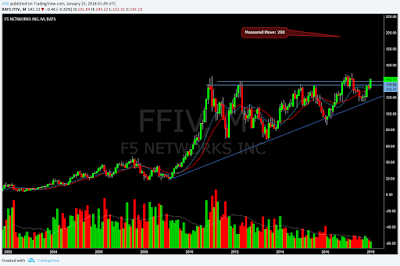
$FFIV - Ready?
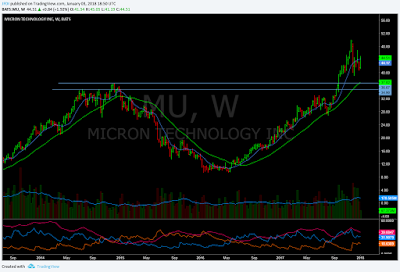
$MU

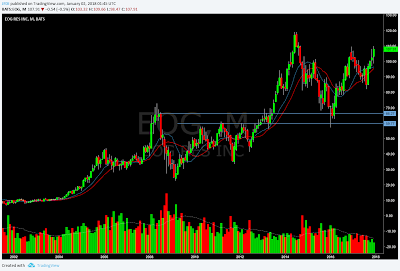
$PXD $EOG
$INTC

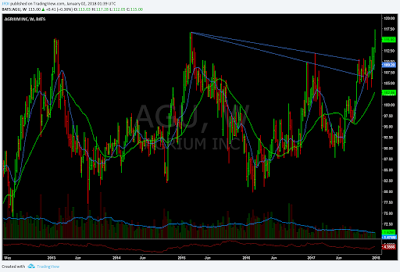
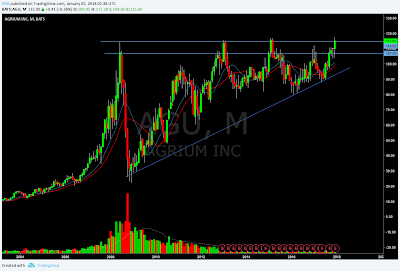
$AGU
$TSLA 500